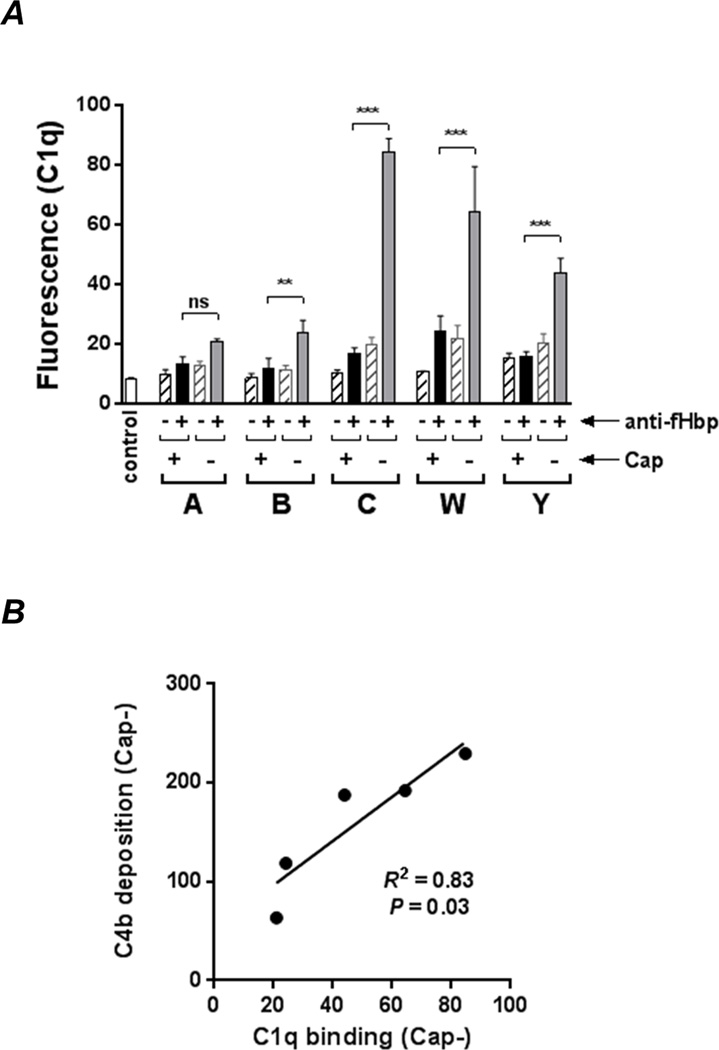
Fig. 3.
Capsule inhibits engagement of C1q by anti-fHbp. A. The Cap+ and Cap− isogenic mutants were incubated with anti-fHbp (10 µg/ml) followed by C1q (20 µg/ml); bound C1q was detected by flow cytometry. Reaction mixtures lacking anti-fHbp is shown by the hatched bars. ‘Control’ represents bacteria plus anti-C1q FITC. *** P<0.001; ** P<0.01; ns, not significant (ANOVA). Representative histograms are shown in Supplemental Figure S2. B. C4b deposition on Cap− mutants correlates directly with the amount of C1q engaged by anti-fHbp. C4b deposition (mean fluorescence values derived from Fig. 2A) was plotted as a function of C1q binding (mean fluorescence values derived from Fig. 3A). Correlation was determined by linear regression with Pearson’s coefficient.

