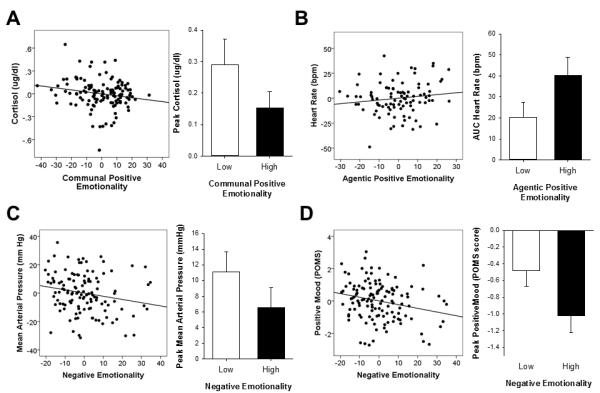
Figure 2.

Significant relationships between personality factors and net peak change (TSST minus control) in stress outcome measures. Scatterplots show partial correlations controlling for other demographic, experimental and personality factors. Bars represent mean±SEM responses for individuals with scores in the top and bottom quartiles for the given trait.
