Figure 4.
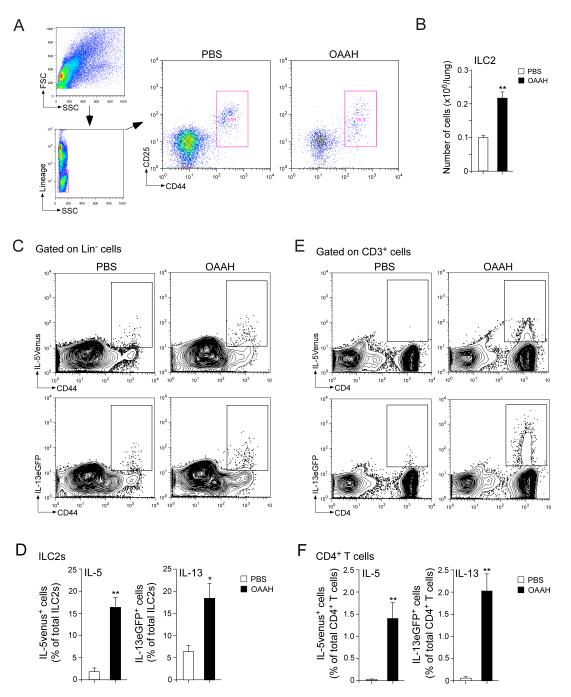
ILC2s and CD4+ T cells are likely the source of IL-5 and IL-13. (A) Naïve wild-type mice were exposed i.n. to PBS or allergens (OAAH) for 4 weeks. Lung single-cell suspensions were gated for the lineage-negative (Lin−) cell population, and ILC2s were identified as CD25+CD44hi cells. (B) The number of ILC2s in the lung specimens was quantitated. (C) IL-5+/venus mice (upper panels) or IL-13+/eGFP mice (lower panels) were exposed to PBS or allergens (OAAH) for 4 weeks. Lung single-cell suspensions were gated for the Lin− cell population, and the expression levels of IL-5venus or IL-13eGFP in the CD44hi population were analyzed by flow cytometry. (D) The proportions of CD44hiIL-5venus+ cells or CD44hiIL-13eGFP+ cells among the ILC2 population were quantitated. (E) Lung single-cell suspensions were gated for the CD3+ population, and the expression levels of IL-5venus or IL-13eGFP in the CD4+ cell population were analyzed by flow cytometry. (F) The proportions of CD44hiIL-5venus+ cells or CD44hiIL-13eGFP+ cells among the CD4+ T cell population were quantitated. Results are the mean ± SEM (n=4 in panel B, n=3 in panels D and F) and are representative of two independent experiments. *: p<0.05, **: p<0.01, compared to mice exposed to PBS.

