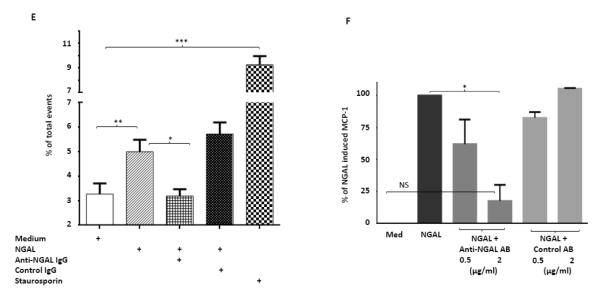
Fig. 8.
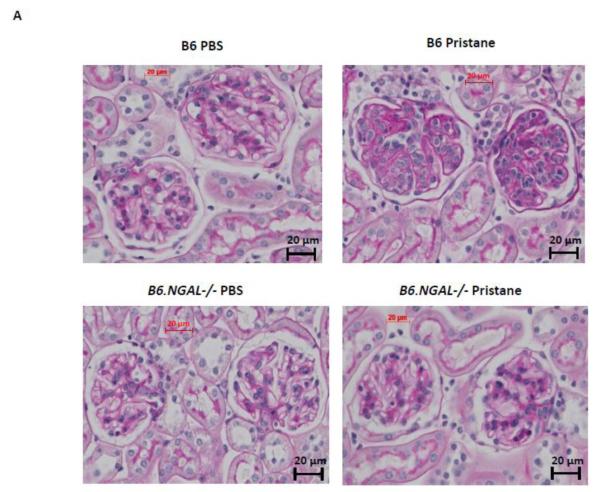
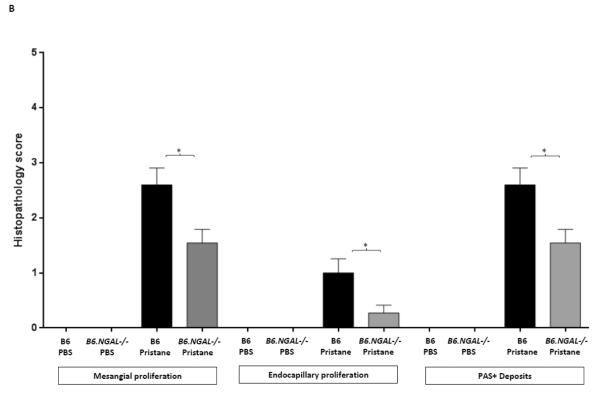
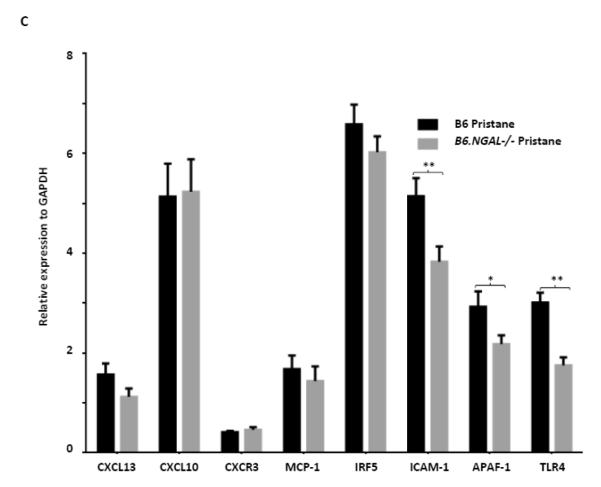
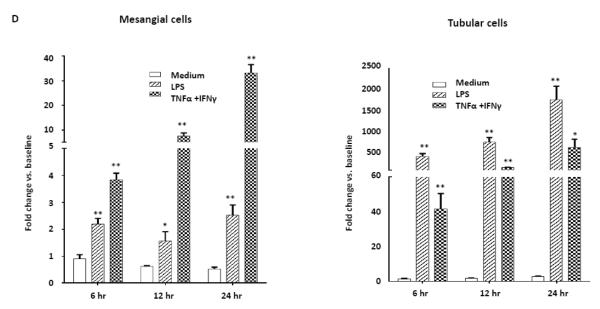
NGAL deficiency restricts renal damage induced by pristane. A,B. Kidney sections from B6 and B6.NGAL−/− mice, 4 months after pristane or PBS challenge, were stained by PAS and H&E and analyzed for pathologic features including mesangial proliferation, endocapillary hypercellularity, and PAS positive deposits. Data was analyzed by Mann-Whitney test (n=4-5 per PBS group, n=10-11 per pristane group) and expressed as mean ± SEM, *p< 0.05. The figure (40x magnification) shows normal appearing glomeruli in PBS-injected B6 (left upper panel) and B6.NGAL−/− mice (left lower panel); pristane-injected B6 mice display global endocapillary proliferation (upper right panel), while glomeruli in pristane-injected B6.NGAL−/− mice are relatively preserved, showing only mild mesangial deposits and mild mesangial hypercellularity (lower right panel). C. Kidney mRNA levels (in duplicate) were measured at 4 months post pristane treatment by real time PCR (n=4-5 per PBS group, n=10-11 per pristane group). Relative expression of mRNA of genes of interest in relation to GAPDH is plotted (Y-axis scale is x 10−3). Data are expressed as mean ± SEM and analyzed by unpaired t-test, *p< 0.05, **p<0.01. D. Kidney mesangial and tubular cells were stimulated with either LPS (5 μg/ml) or TNFα +IFNγ (each at 5 ng/ml), and the mRNA expression of NGAL at 6, 12 and 24 hours was analyzed in 3-4 replicates by real time PCR. Relative expression of NGAL mRNA in relation to GAPDH was calculated. Fold change at each time point was calculated as the relative ratio to baseline just prior to stimulation. Data are representative of results from two independent experiments, performed in 3-4 replicates. Data are expressed as mean ± SEM and analyzed by unpaired t-test, *p< 0.05, **p<0.01, compared to medium treated group at each respective time point. E. Mesangial cells were stimulated with the NGAL at 10 μg/ml with or without anti-NGAL antibody or control IgG at 100 μg/ml in duplicate for 24 hours, and the degree of apoptosis analyzed by Annexin V and 7-AAD staining and flow cytometry. A total of 50,000 events were recorded per sample. Percentage of annexin-V and 7-AAD double positive cells were plotted against the treatment. Data are representative of results from two independent experiments, performed in 3-4 replicates. Data are expressed as mean ± SEM and analyzed by unpaired t-test, *p<0.05, **p<0.01, ***p<0.001. F. Mesangial cells were stimulated for 24 hours with NGAL at 1 μg/ml in presence and absence of anti-NGAL antibody or control IgG at 0.5 and 2 μg/ml (3-4 replicates), and the supernatant was analyzed for MCP-1 by ELISA. The percentage of NGAL induced MCP-1 was calculated by subtracting the value for media alone from each treatment group, and comparing this to the concentration of MCP-1 induced by NGAL alone which was set as 100%. Data are representative of results from two independent experiments, performed in 3-4 replicates. Data are expressed as mean ± SEM and analyzed by unpaired t-test, *p<0.05.

