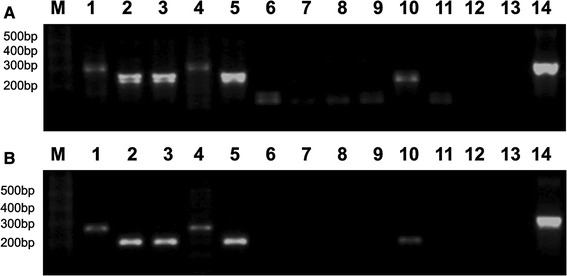
Fig. 1.

Nested RT-PCR products obtained from the control frozen tumor tissues and PB specimens of ES patients visualized by electrophoresis in 2 % agarose gel stained with ethidium bromide. a The second round of amplification was performed using one-fifth of the first round PCR product. b The second round of amplification was performed using one-fifth of the 10× dilution of the first round PCR product. M: 1-kb Plus DNA ladder (Invitrogen). Lanes 1–5 PCR products from frozen tumor tissues; lanes 6–11 PCR products from selected PB specimens from ES patients; lanes 12, 13 PCR negative controls for two rounds of amplification; lane 14 positive control, EWS–FLI1 type 2 fusion (RD-ES cell line). Lanes 2, 3, 5, and 10 EWS–FLI1 type 1 fusions, lanes 1 and 4 EWS–FLI1 type 2 fusions
