Fig. 2.

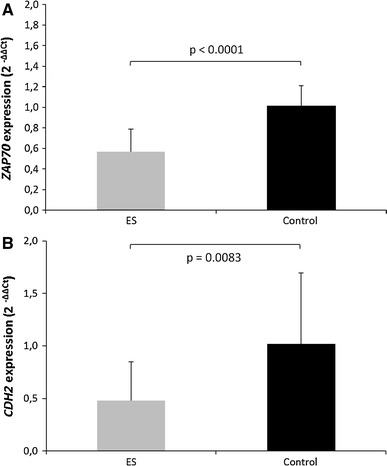
Analyses of the relative gene expression level of a ZAP70 and b CDH2 genes performed by qRT-PCR, using RNA samples from PB cells of ES patients and healthy individuals. The error bars represent standard deviation from the mean 2−ΔΔCt

Analyses of the relative gene expression level of a ZAP70 and b CDH2 genes performed by qRT-PCR, using RNA samples from PB cells of ES patients and healthy individuals. The error bars represent standard deviation from the mean 2−ΔΔCt