Figure 2.

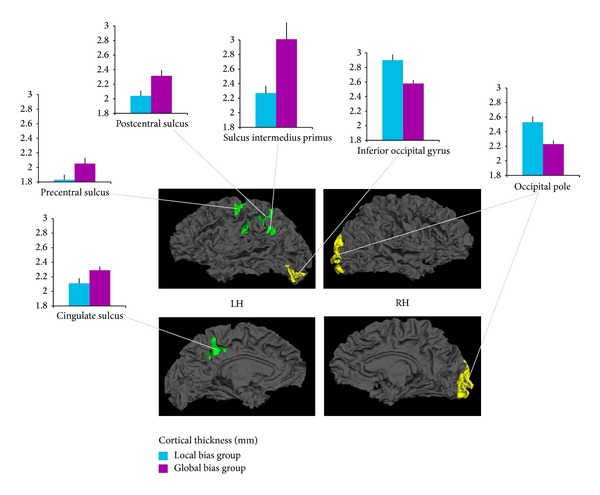
3D rendering of local brain regions showing significant decreases (yellow) and increases (green) in cortical thickness (in mm) between children in the local bias group and the global bias group. LH: left hemisphere; RH: right hemisphere.

3D rendering of local brain regions showing significant decreases (yellow) and increases (green) in cortical thickness (in mm) between children in the local bias group and the global bias group. LH: left hemisphere; RH: right hemisphere.