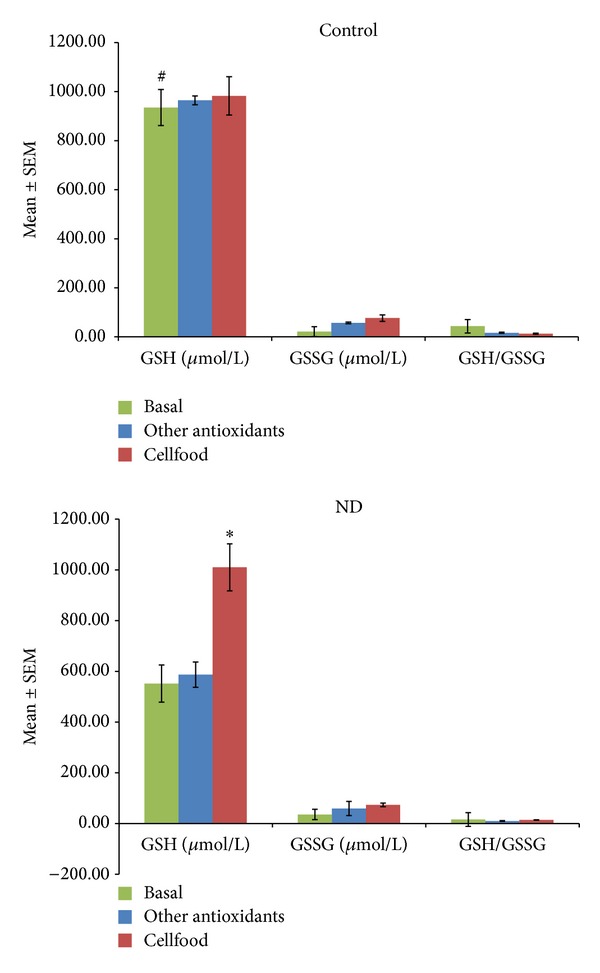
Figure 6.

Free glutathione (GSH) and oxidized glutathione (GSSH) levels and GSH/GSSH ratios measured in blood obtained from subjects unaffected (control) or patients affected by neurodegenerative diseases (ND). All subjects' values were determined before the beginning (basal values) and after three months of treatment with Cellfood or other antioxidants (see text). *P < 0.05 versus all basal values; # P < 0.05 C versus ND (basal values).
