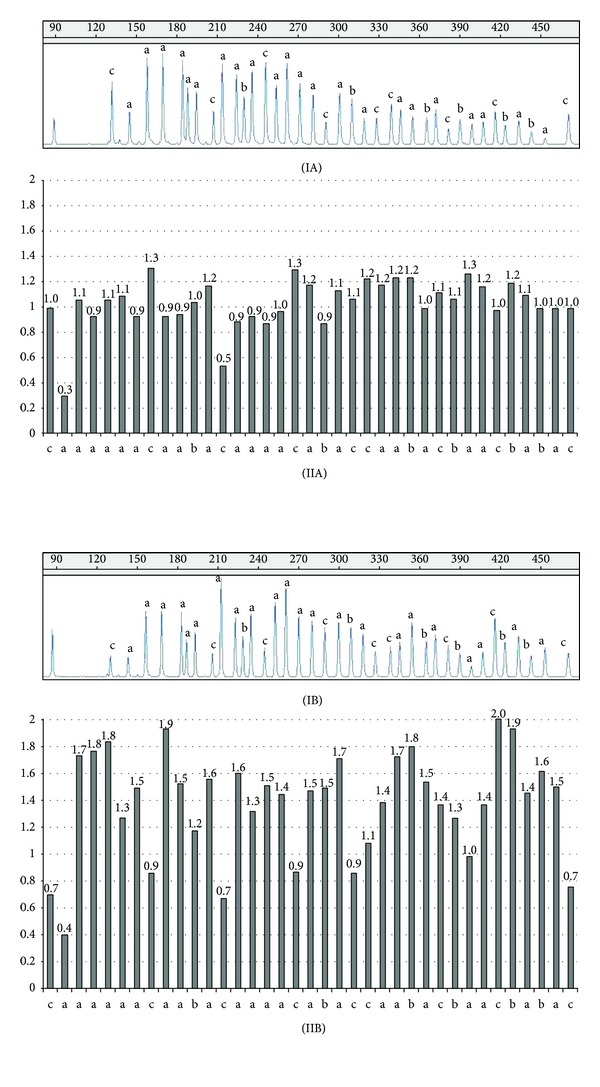
Figure 1.

(I) Representative MLPA peak patterns of the IGF1R and IGFBP3 genes. The numbers in the top portion of panels (IA) and (IB) represent the fragment size in the capillary electrophoresis analysis. (II) Histogram showing the normalized data with results of three control individuals and internal controls (reference probes). Normalized relative values, ranging within a confidence interval of 0.7 to 1.3, were established by control data variations and correspond to two gene copies in the genotype. The values in y-axis correspond to the normalized relative value and the number on the top of each bar represents the normalized value for each probe. (A) Normal adrenal gland. (B) Adrenocortical tumor with IGF1R and IGFBP3 amplification. Some reference probes in this tumor are also amplified. (a): twenty-two IGF1R probes. (b): six IGFBP3 probes. (c): reference probes.
