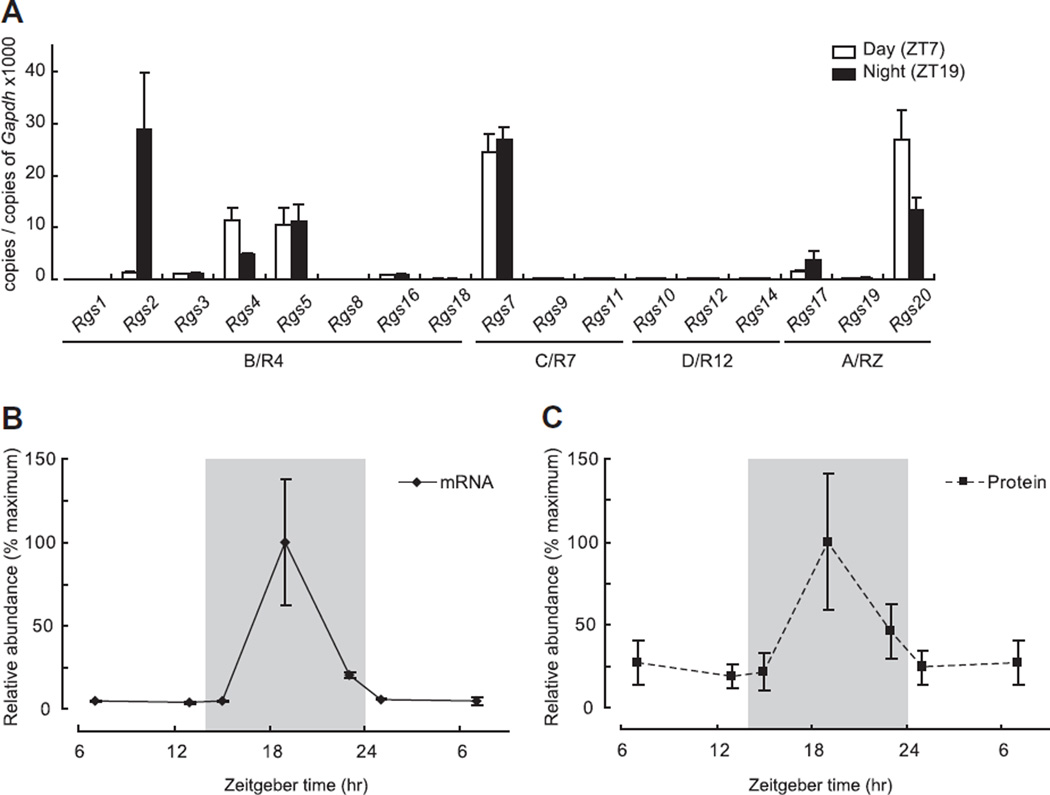
Fig. 1.
Transcript levels of RGS family members in pineal glands obtained during the day or night. (A) Transcript levels of 17 RGS members in pineal gland either at day (Zeitgeber time; ZT7, white box) or night (ZT19, black box) are shown. Rgs2, Rgs4 and Rgs20 exhibited significantly different expression levels between ZT7 and ZT19 (ZT7 vs ZT19 of Rgs2: 1.3 ± 0.12 vs 28.9 ± 6.28; Rgs4: 11.4 ± 1.32 vs 4.7 ± 0.23; Rgs20: 26.9 ± 3.27 vs 13.4 ± 1.28, P < 0.05, two-tailed t-test, n = 3 each). Note Rgs2 was the only molecule that had higher expression at ZT19. (B and C) Levels of Rgs2 mRNA or RGS2 protein expression are shown relative to their peak at ZT19. Gray shading indicates time when lights were off (night time), and the expression value at ZT7 is plotted twice for presentation. For further details see Section 2.

