FIGURE 3.
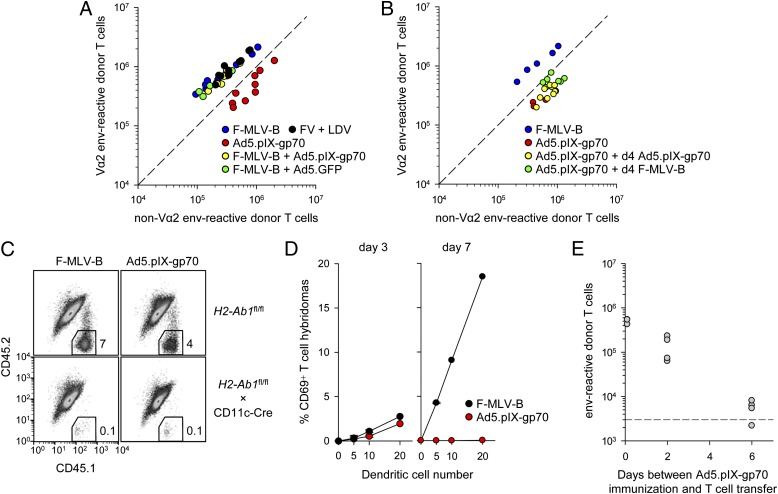
In vivo kinetics of Ag presentation following F-MLV-B infection or Ad5.pIX-gp70 immunization. (A) Absolute numbers of Vα2 or non–Vα2 donor env-specific EF4.1 CD4+ T cells in the spleens of recipient mice 7 d after immunization with the indicated combination of viruses at the time of T cell transfer. (B) Absolute numbers of Vα2 or non–Vα2 donor env-specific EF4.1 CD4+ T cells in the spleens of recipient mice 7 d after priming with Ad5.pIX-gp70 at the time of T cell transfer (day 0) followed by additional administration of either F-MLV-B or Ad5.pIX-gp70 on day 4. F-MLV-B infection or Ad5.pIX-gp70 immunization on day 0 was also included as control. (C) Representative flow cytometric profiles of CD4+ T cells, distinguishing host (CD45.1+CD45.2+) and donor (CD45.1+CD45.2−) cells from the spleens of either control mice (H2-Ab1fl/fl) or mice lacking DC expression of MHC class II (H2-Ab1fl/fl × CD11c-Cre) 7 d following adoptive transfer of EF4.1 T cells and F-MLV-B infection or Ad5.pIX-gp70 immunization. Data are representative of two mice per genotype per virus. (D) CD69 expression in env-specific T cell hybridomas following overnight culture with the indicated number of DCs isolated from the spleens of F-MLV-B–infected or Ad5.pIX-gp70–immunized WT mice at the indicated times after immunization. Data are pooled from two experiments. (E) Absolute numbers of total splenic env-specific EF4.1 CD4+ T cells 7 d after transfer into recipient mice that had been immunized with Ad5.pIX-gp70 0, 2, or 6 d previously. The dashed line represents recovery from nonimmunized recipients. In (A), (B), and (E), each symbol is an individual mouse.

