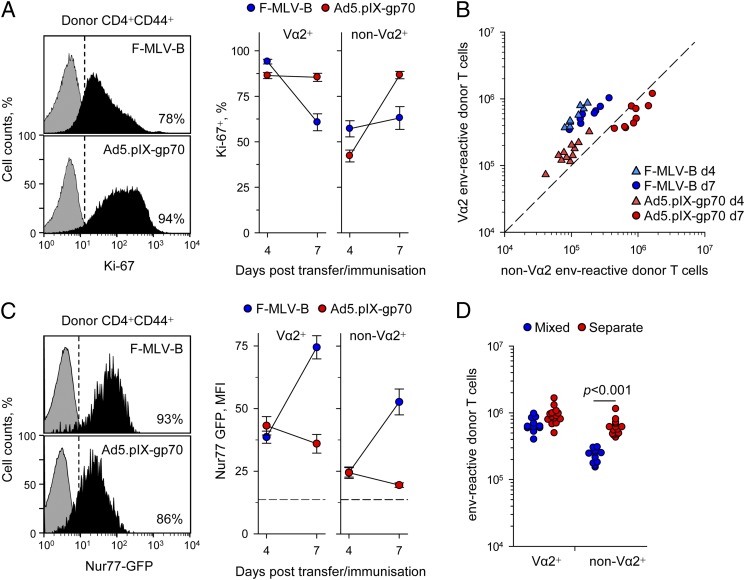
FIGURE 5.
Proliferation kinetics of EF4.1 CD4+ T cells responding to FV infection or Ad5.pIX-gp70 immunization. (A) Representative flow cytometric assessment of Ki-67 expression on day 7 in donor env-specific EF4.1 CD4+ T cells (left) and frequency of Ki-67+ Vα2 or non–Vα2 donor env-specific EF4.1 CD4+ T cells 4 and 7 d after transfer into F-MLV-B–infected or Ad5.pIX-gp70–immunized recipients. Data are means of six to nine mice from three experiments. (B) Absolute numbers of splenic Vα2 or non–Vα2 donor env-specific EF4.1 CD4+ T cells 4 and 7 d after transfer into F-MLV-B–infected or Ad5.pIX-gp70–immunized recipients. (C) Representative flow cytometric assessment of Nur77-driven GFP expression on day 7 in donor env-specific EF4.1 CD4+ T cells (left) and mean fluorescence intensity (MFI) of GFP expression in Vα2 or non–Vα2 donor env-specific EF4.1 CD4+ T cells 4 and 7 d after transfer into F-MLV-B–infected or Ad5.pIX-gp70–immunized recipients. Data are means of eight mice from three experiments. The dashed line represents MFI of GFP signal in nonactivated cells. (D) Absolute numbers of splenic Vα2 or non–Vα2 donor env-specific EF4.1 CD4+ T cells 7 d after transfer into FV-infected recipients of either total EF4.1 CD4+ T cells, containing both Vα2 or non–Vα2 cells (mixed), or purified Vα2 or non–Vα2 EF4.1 CD4+ T cells separately (separate). In (B) and (D), each symbol is an individual mouse.

