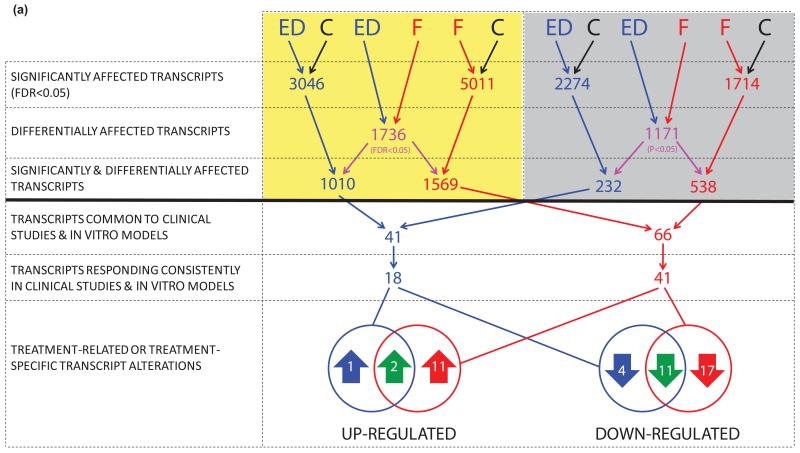
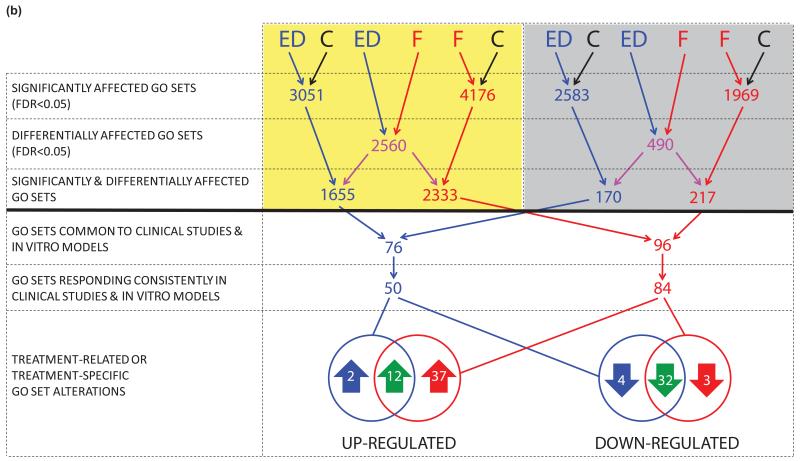
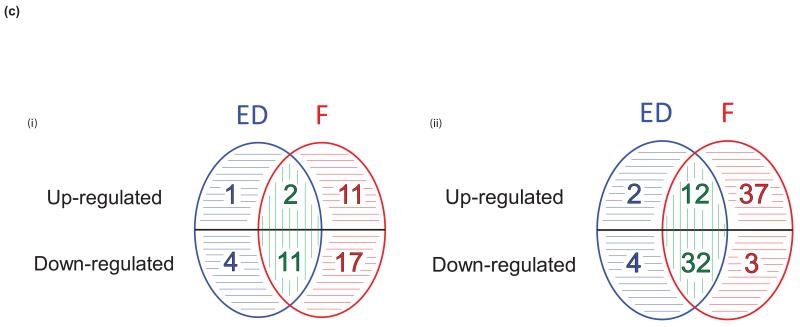
Figure 3.
Summary of analytical strategy with (a) resultant transcripts and (b) Gene Ontology (GO) functional gene sets. Key: In vitro models (yellow panel), pre-surgical studies (grey panel), control conditions in vitro / pre-treatment clinical samples (C, black), E-deprivation (ED, blue), Fulvestrant (F, red), ED and F (green). Transcripts and GO sets resulting from comparative analyses are detailed in Web Appendix 1. (c) Summary of (i) transcripts and (ii) GO functional gene sets affected by E-deprivation (ED, blue), fulvestrant (F, red), or both (green), with treatment-specific and quantitative differences indicated by horizontal and vertical stripes respectively.


