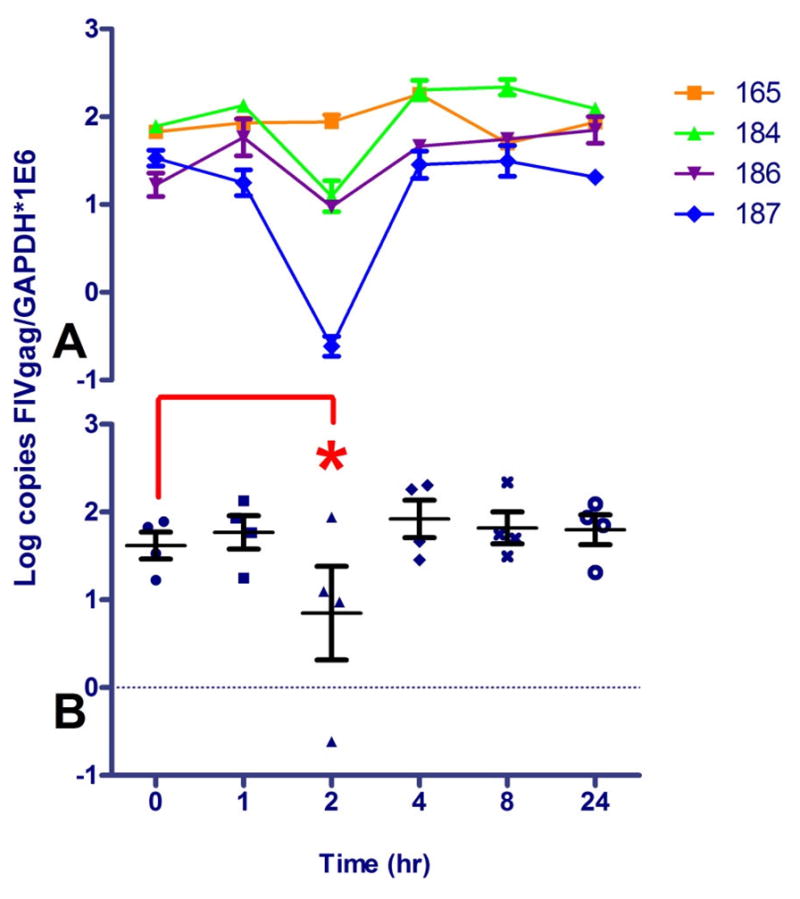
Figure 5.

PBMC FIV DNA load at various time points before (0) and after oral SAHA administration to 4 FIV+ cats (165, 184, 186, and 187). Copies of FIV gag were normalized to cellular GAPDH. The average and standard deviation of triplicate measurements for individual animals are shown in (A), and the average and standard deviation of all 4 FIV+ animals are graphed in (B). A one-way ANOVA followed by Dunnett’s multiple comparison post-test using time 0 (pre-dose) as the control was performed to determine if there was a significant change in the level of viral DNA after drug administration; *p < 0.05. DNA from the FIV- control cat (185) was below the limit of detection of FIV gag at all time points (not shown).
