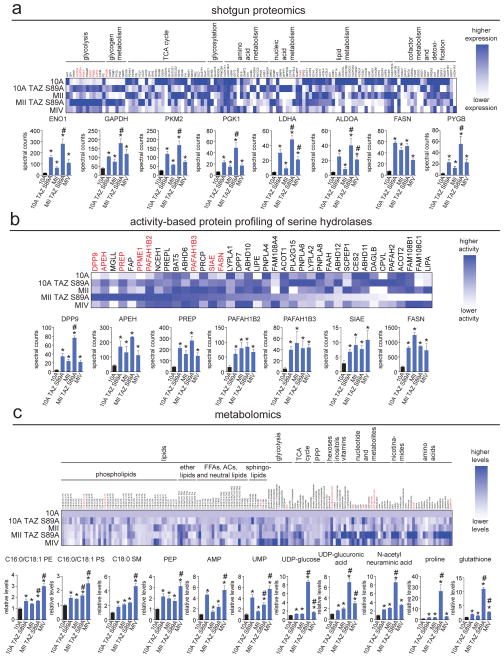
Figure 1. Identifying dysregulated metabolic enzymes in breast cancer progression model.
(a) Shotgun proteomic profiling of metabolic enzyme expression in the breast cancer progression model by MudPIT. Upper heat map shows relative protein expression of each protein, normalized to the highest expression of each protein across the 5 cell lines. Dark blue corresponds to high expression and white or light blue corresponds to lower expression. Lower bar graphs show the metabolic enzymes that were significantly upregulated across 10A TAZ S89A, MII, MII TAZ S89A, and MIV cells. (b) ABPP of serine hydrolase activities in the breast cancer progression model by ABPP-MudPIT using the fluorophosphonate-biotin serine hydrolase activity-based probe. Upper heat map shows relative serine hydrolase activities of each protein, normalized to the highest expression of each protein across the 5 cell lines. Dark blue corresponds to high activity and white or light blue corresponds to lower activity. Lower bar graphs show the serine hydrolase activities that were significantly upregulated across 10A TAZ S89A, MII, MII TAZ S89A, and MIV cells. (c) Metabolomic profiling of the breast cancer progression model using SRM-based targeted LC/MS/MS. Upper heat map shows relative metabolite activities normalized to MCF10A control cells. Dark blue corresponds to high levels and white corresponds to lower levels. Lower bar graphs show the metabolites that were significantly elevated in levels across 10A TAZ S89A, MII, MII TAZ S89A, and MIV cells. Data in bar graphs are presented as mean ± sem; n = 4–6/group. Significance is presented as *p < 0.05 compared to MCF10A control cells, #p<0.05 compared to MII cells. Detailed data is shown in Table S1. Characterization of breast cancer progression model, TAZ S89A-specific changes in metabolic enzymes, additional data showing regulation of these metabolic enzyme targets by the Hippo pathway, and additional data showing regulation of glycolytic metabolism by RAS and TAZ S89A are shown in Figure S1.

