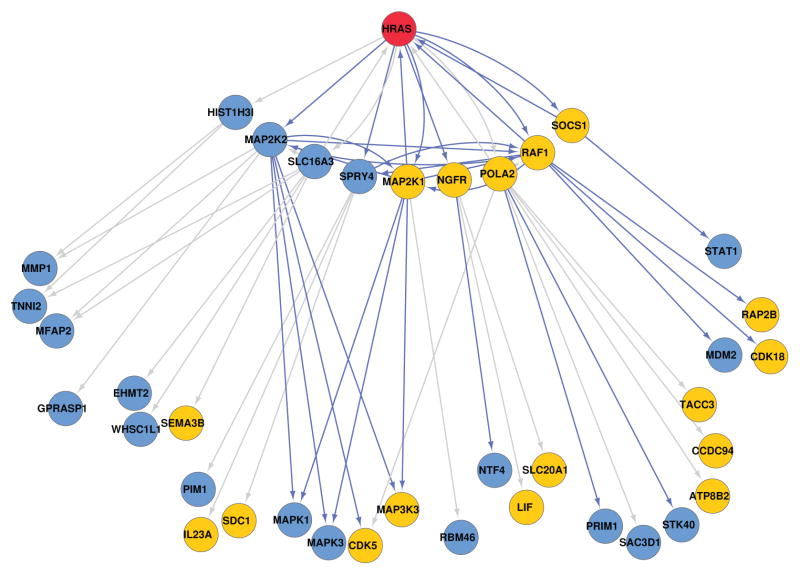
Fig. 3.
Children and grandchildren of HRAS (red node) inferred using predictionet, equal weight between training data and prior knowledge (prior weight w = 0.5). The yellow nodes (genes) are the ones identified as significantly affected by HRAS based on the validation samples. The remaining nodes, colored in blue, have been predicted as affected during network inference while they were not identified as significantly affected in the validation samples. Blue edges are known interactions (priors) while grey edges represent new interactions.

