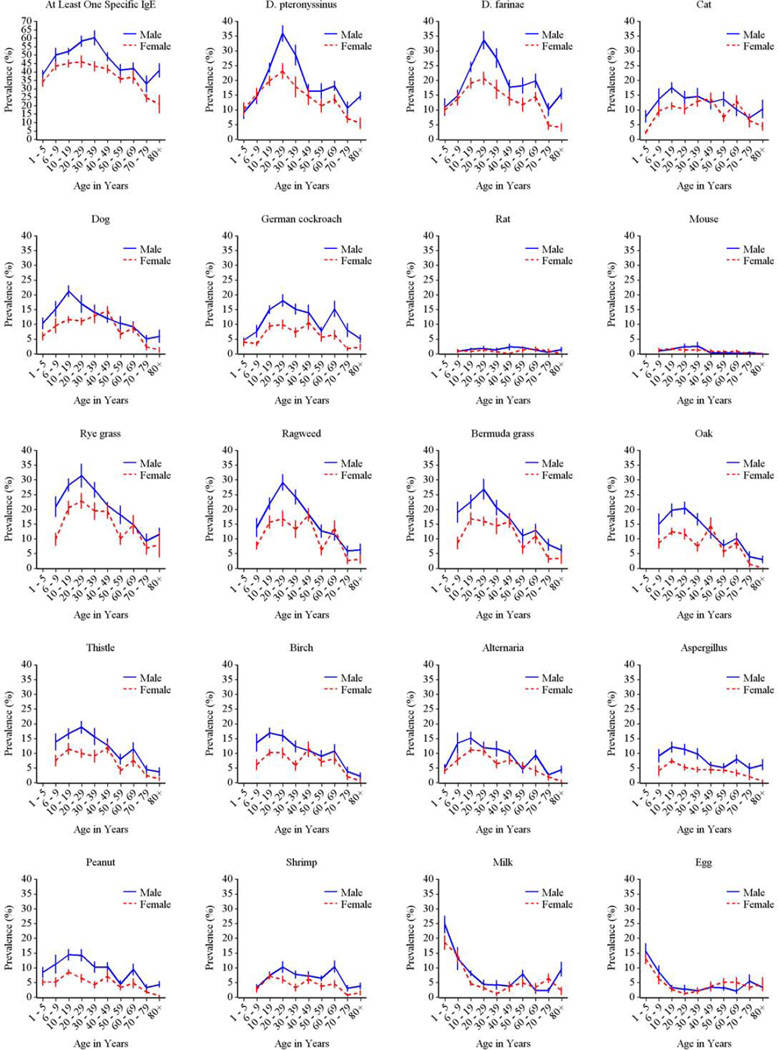
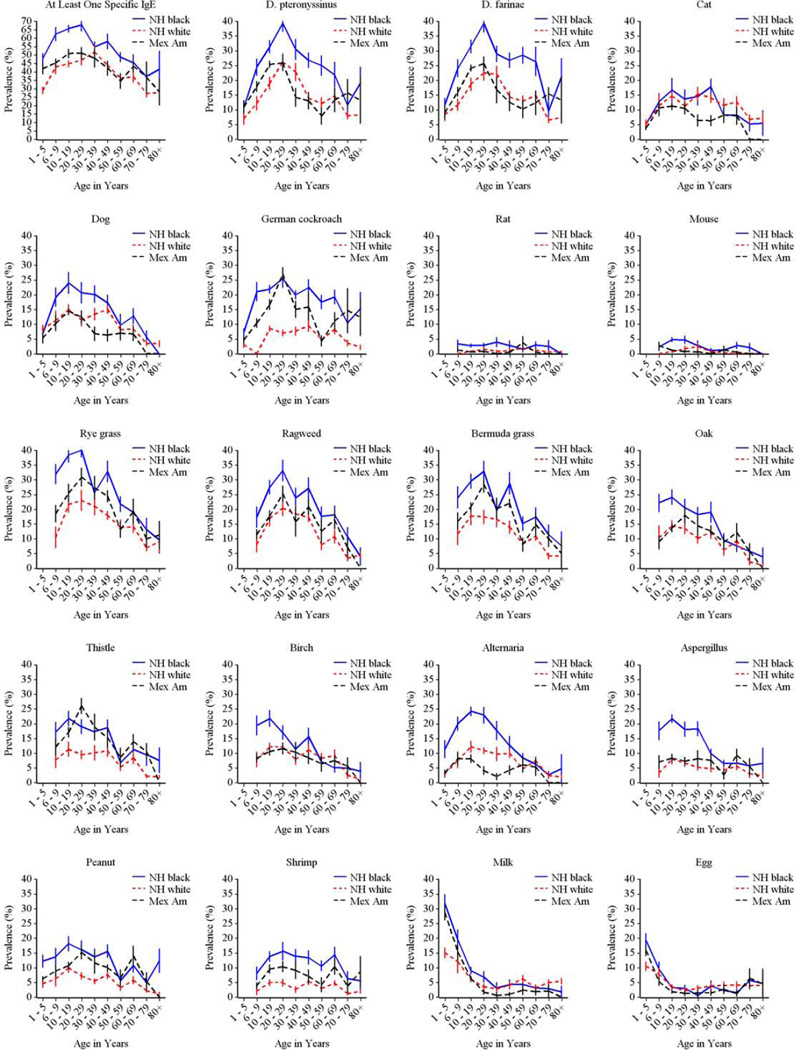
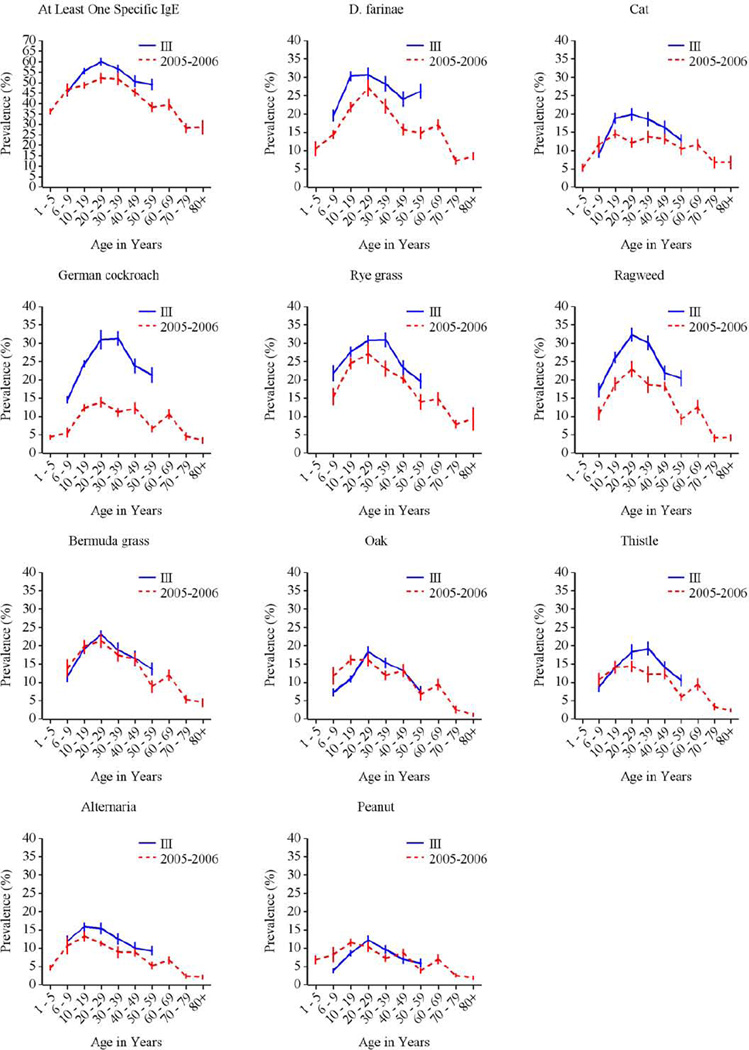
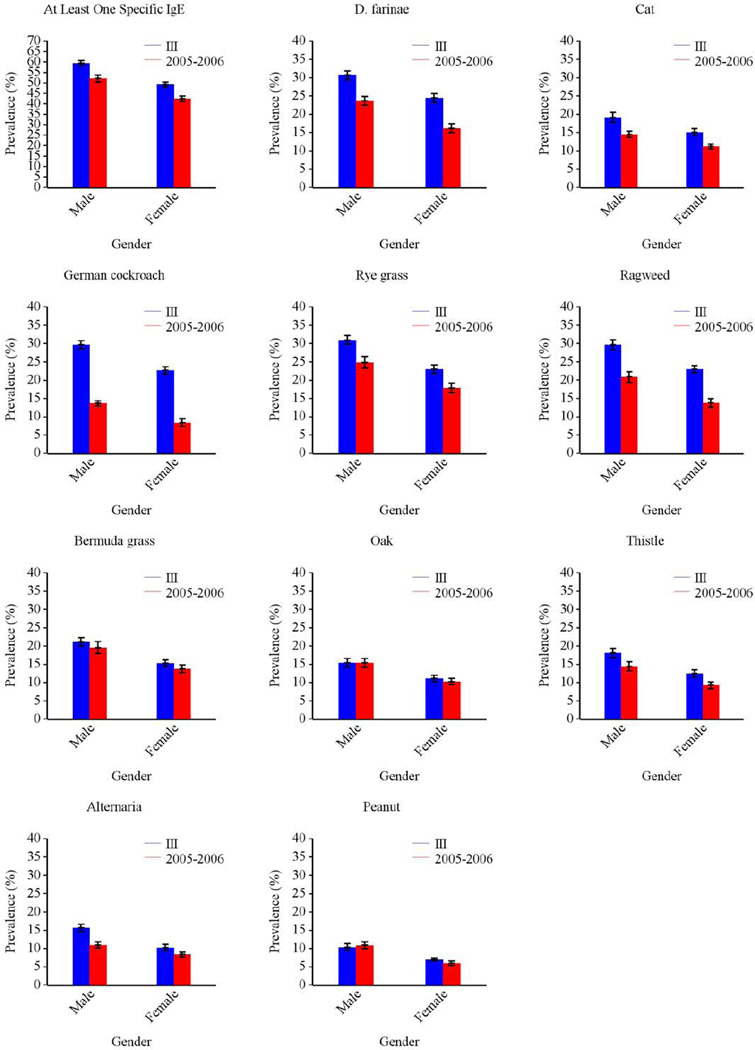
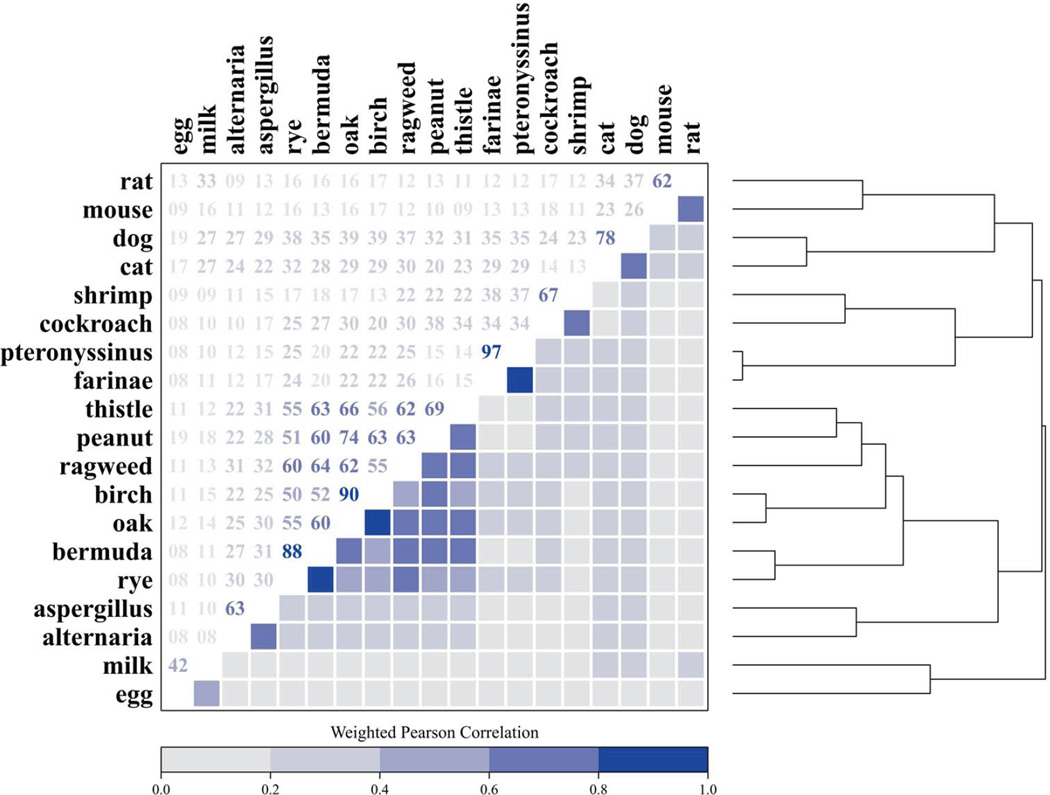
Figure 2.
Clustering of the allergen-specific IgEs. The dendrogram (right) employs hierarchical clustering to group similar sIgEs based on the log-transformed correlation matrix (left). Hierarchical cluster analysis identified 7 IgE clusters: 1) plants (grass-, tree-, weed-, and peanut-specific IgEs); 2) dust mites (D. farinae and D. pteronyssinus); 3) pets (dog and cat); 4) cockroach and shrimp; 5) molds (Alternaria and Aspergillus); 6) foods (egg white, cow’s milk); and 7) rodents (mouse and rat).

