
Figure 1. Lung inflammation in SRA knockout mice after repetitive ODE exposures.
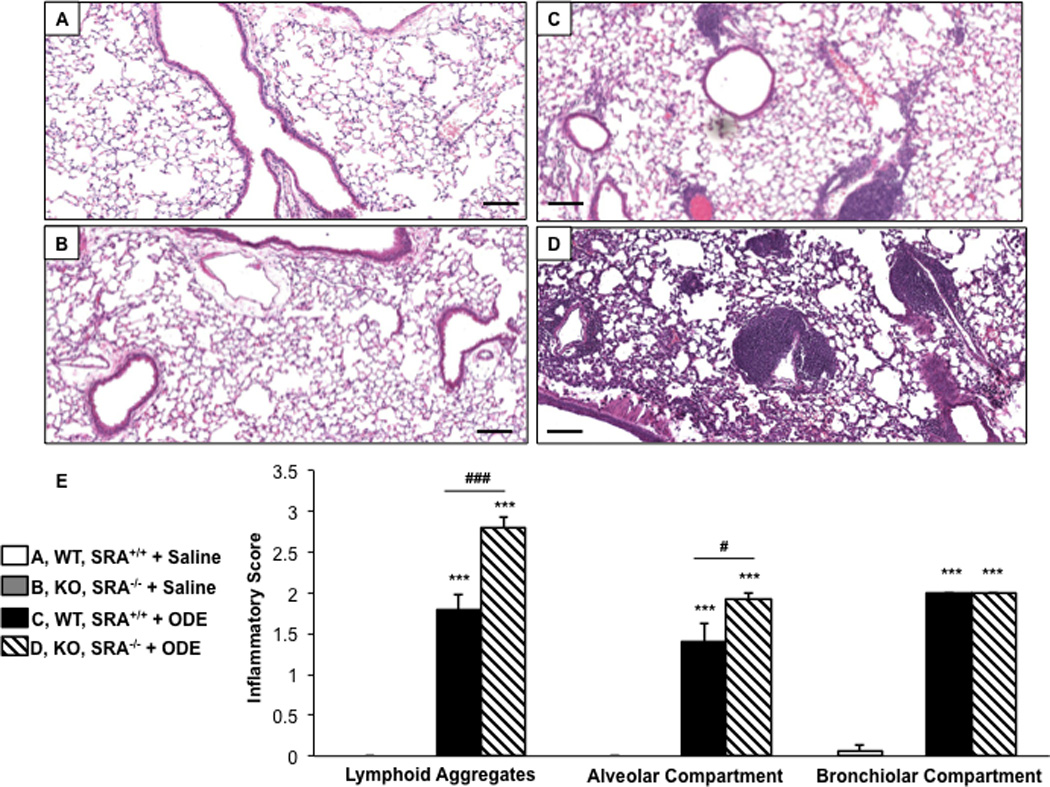
Mice were intra-nasally treated with saline or organic dust extract (ODE) daily for 3 wk. A representative 4–5-µm thick section (H&E stained) of one mouse per treatment group is shown (10× magnification). (A) Wild-type (WT) SRA+/+ + saline. (B) Knockout (KO) SRA−/− + saline. (C) WT + ODE. (D) KO + ODE. (E) Mean semi-quantitative distribution of inflammatory scores of lung lymphoid aggregates, alveolar inflammation and bronchiolar inflammation in mice (n = 4–5 mice/group). Error bars represent SE. Statistically significant (***p < 0.001) vs. saline. #p < 0.05 and ###p < 0.001: significant differences between groups as indicated (1-way ANOVA with Tukey’s post-hoc comparison). Line scale represents 100 µm.