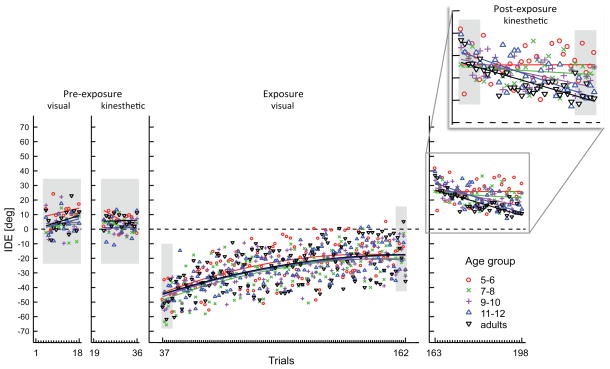
Figure 2.
IDE group means as a function of trials; the regression lines in the pre- and post-exposure panels represent a linear fit for the group mean per trial for each age group. For the exposure phase, a quadratic fit is displayed for the data of each group. The shaded areas indicate the trial blocks that were used for statistical analysis. The post-exposure phase has been blown up to make the linear fits for the different age groups better visible.

