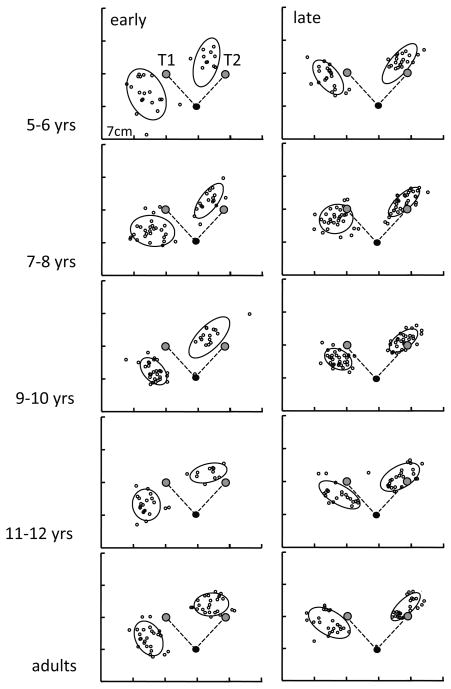
Figure 4.
EPE distributions: for each age group, during the early phase of post-exposure (left column) and the late phase (right column). The gray dots marked with T1, T2 denote the position of the kinesthetic targets (which matched the visual target positions displayed on the monitor above the workspace). The dashed lines from the black circles (home position) to the targets denote the target vector. The confidence ellipses are centered on the sample means of EPX and EPY, with the unbiased sample standard deviations of x and y determining their major axes.

