
Figure 6.
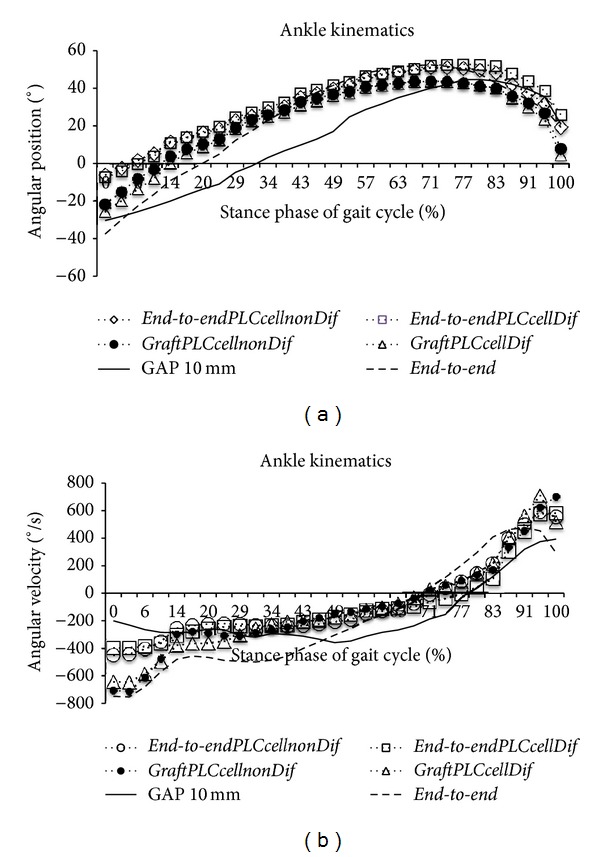
Kinematic plots in the sagittal plane for angular position (°) (a) and for angular velocity (°/s) (b) as it moves through the stance phase, obtained at week 20 after the neurotmesis injury. The mean of each group is plotted (N = 6).
Official websites use .gov
A
.gov website belongs to an official
government organization in the United States.
Secure .gov websites use HTTPS
A lock (
) or https:// means you've safely
connected to the .gov website. Share sensitive
information only on official, secure websites.
Kinematic plots in the sagittal plane for angular position (°) (a) and for angular velocity (°/s) (b) as it moves through the stance phase, obtained at week 20 after the neurotmesis injury. The mean of each group is plotted (N = 6).