
Figure 9.
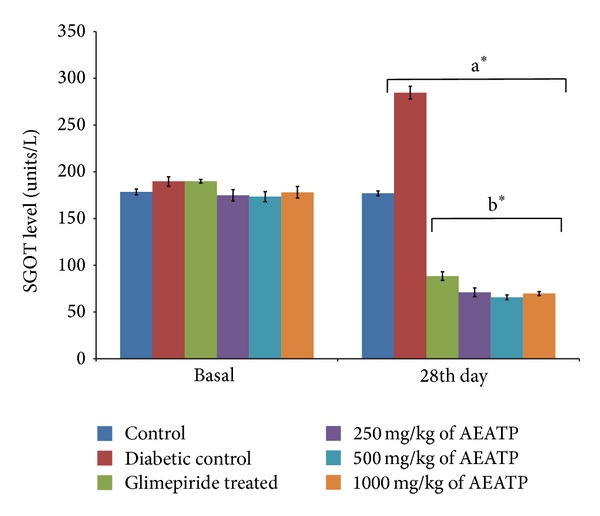
Effect of AEATP on SGOT level (unit/lit.) in type-2 diabetic Wistar rats. Each group (n = 6) represents mean ± standard error of means. Data was analyzed by using Two way ANOVA followed by Tukey's multiple test; a versus control, b versus Diabetic control, c versus Glimepiride treated, d versus 250 mg/kg of AEATP, e versus 500 mg/kg of AEATP. *P < 0.0001, # P < 0.001, † P < 0.01, ‡ P < 0.05.