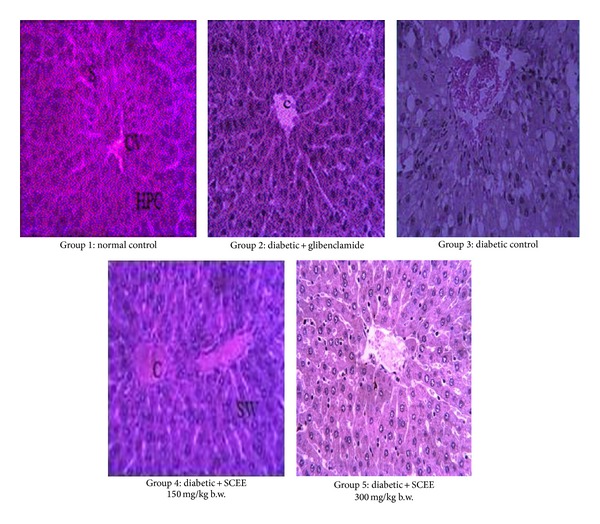
Figure 1.

Microphotographs of liver histology of different groups after treatments of SCEE (H&E staining, 40x). CV: central venule, HPC: hepatocytes, S: sinosides, DLS: degeneration of lobular shape, FC: fatty change, CI: inflammatory cells infiltration, C: congestion, SW: sinusoids widening, and SCEE: S. cordata ethyl acetate fraction.
