
Figure 4.
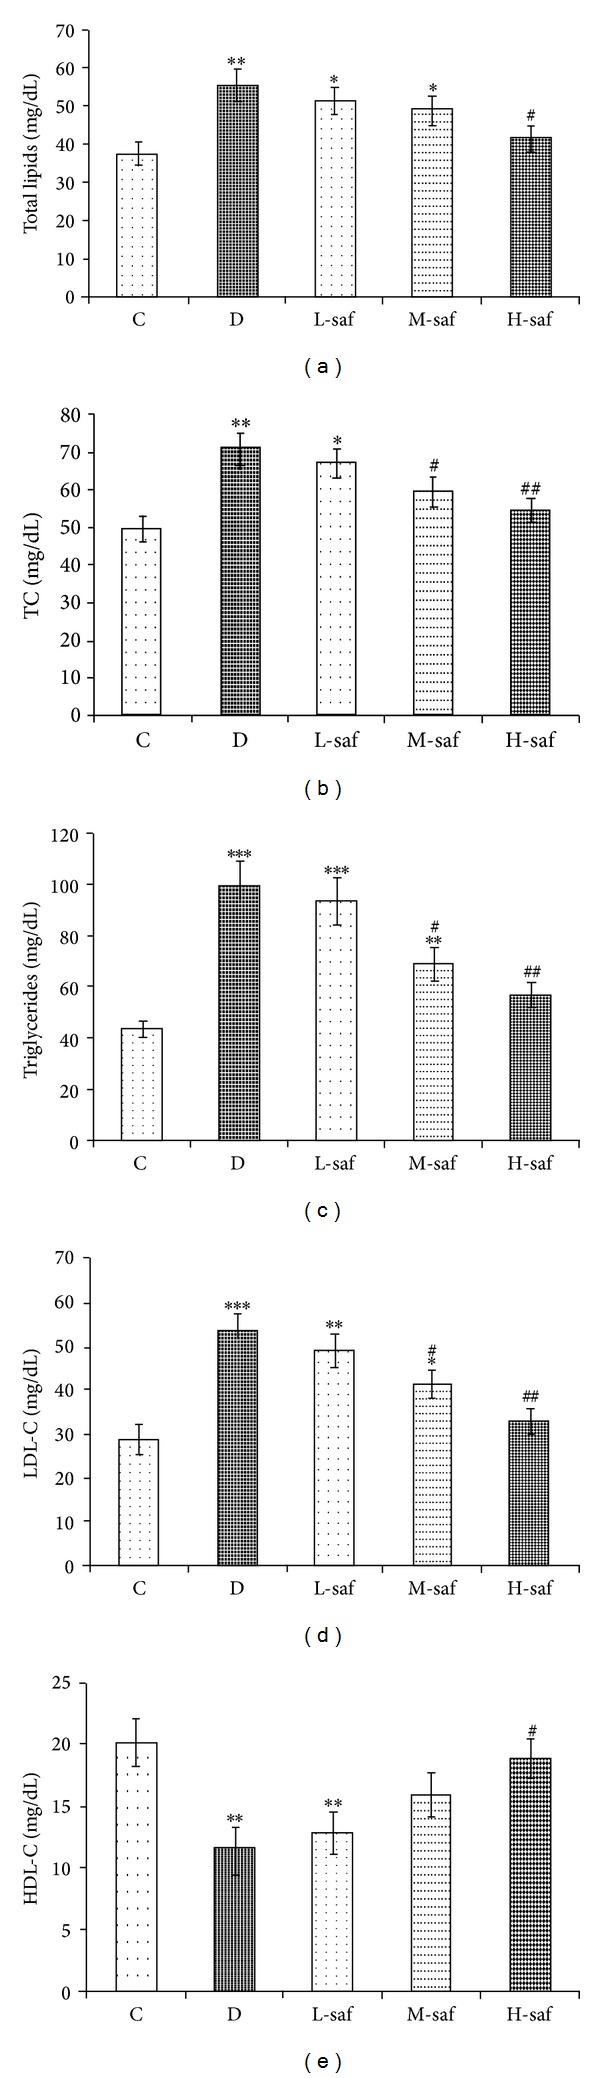
Effect of saffron extract on plasma lipid profiles (mg/dL) (a) total lipid, (b) total cholesterol (TC), (c) triglycerides, (d) LDL-C, (e) HDL-C, in control (C), untreated diabetic rats (D), saffron extract (20 mg/kg/day)—treated diabetic (L-saf), saffron extract (40 mg/kg/day)—treated diabetic (M-saf) and saffron extract (80 mg/kg/day)—treated diabetic (H-saf) rats during 4 weeks of study (n = 10, for each group). Values are the mean ± SEM. Statistical significance for the difference between the data of the control group versus other groups: *P < 0.05, **P < 0.01, ***P < 0.001. Statistical significance for the difference between the data of untreated diabetic group versus treated groups: # P < 0.05, ## P < 0.01.