
Figure 3.
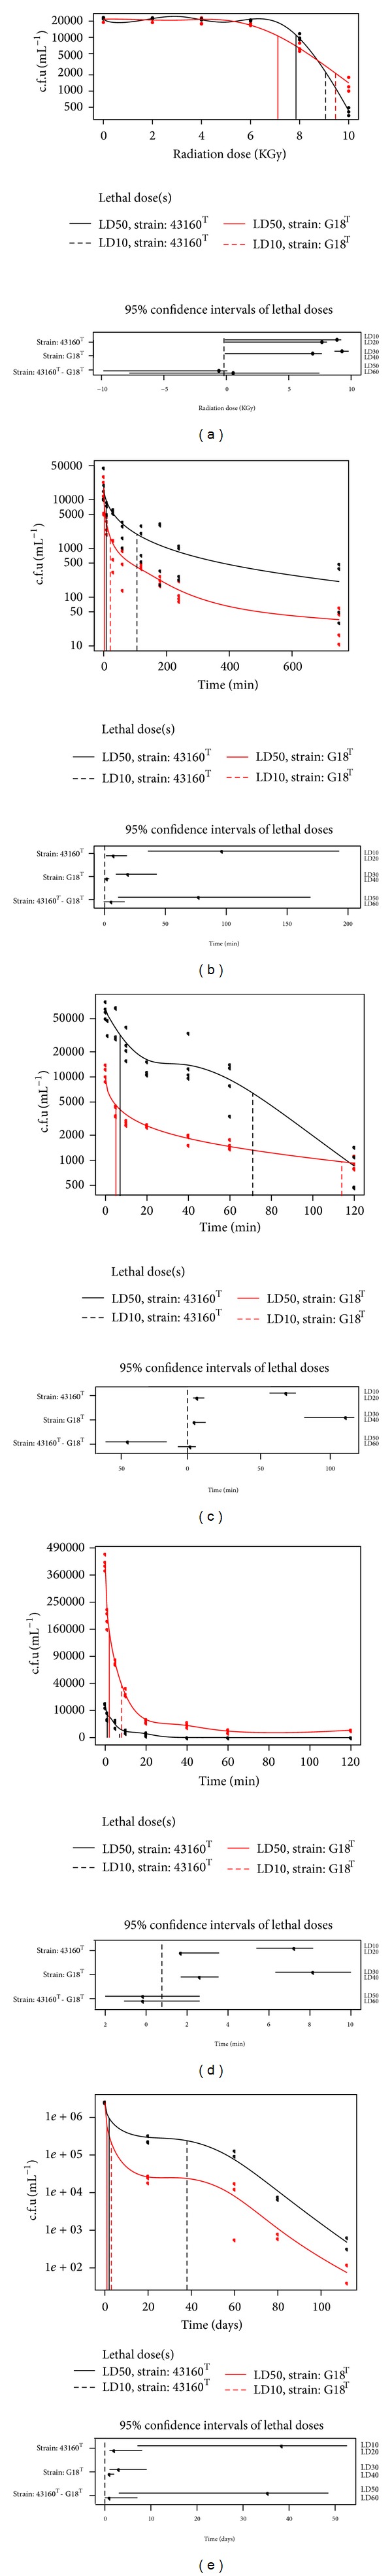
Estimation of survival following exposure to gamma-radiation (a), UV-radiation (b), mitomycin C (c), hydrogen peroxide (d), and desiccation (e) for strain G18T and G. obscurus DSM 43160T as positive control. The mean c.f.u.mL−1 per strain is given together with the LD50 and LD10 values in the upper panel of each figure; y-axis is on a logarithmic scale ((a)–(c), (e)), or on a square root scale (d). The lower panel depicts LD10 and LD50 values per strain and the differences between strains together with confidence intervals. Confidence intervals that do not contain zero (dashed vertical line) indicate significant differences to zero; in case of strain differences this indicates significant differences between strains.