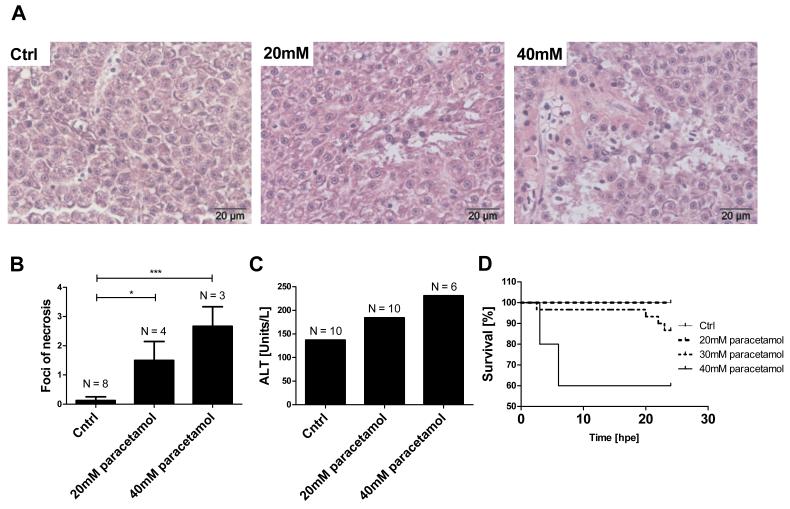
Figure 2.
Effect of paracetamol exposure on adult zebrafish. Paracetamol treatment was for 3 hours, all measurements made 24 hpe. (A) Histological images of adult zebrafish liver at the indicated paracetamol concentrations; both treatment groups displayed liver necrosis. (B) Mean foci of necrosis per liver section at the indicated paracetamol concentrations. N= number of fish per treatment group. Error bars represent SEM, *p<0.05, ***p<0.001 (C) Serum ALT activity in pooled samples from each treatment group. N = the number of pooled fish for ALT measurement (D) Survival curves for experimental groups n = 10/group. There was a significant difference between treatment groups, P=0.02.

