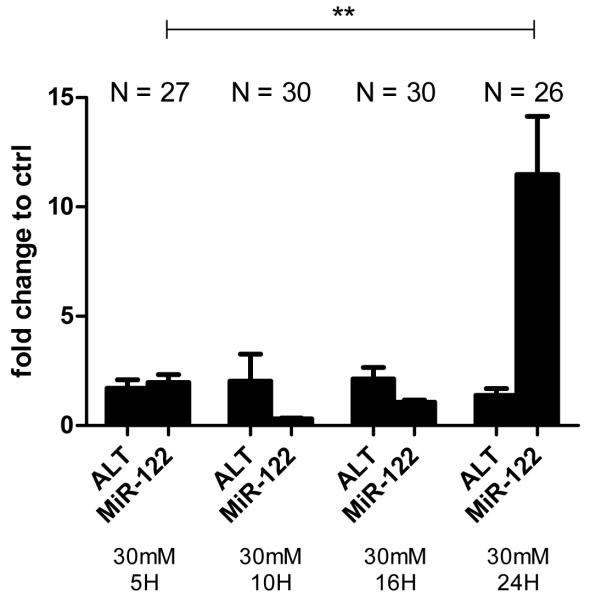
Figure 5.
Serum ALT activity and miR-122 5-24hpe to 3 hours of paracetamol (30mM). ALT and miR-122 are expressed as fold change compared to controls run at each timepoint. Values are mean, error bars are SEM. Zebrafish were equally divided across 3 replicate experiments giving the indicated total numbers per group (N). **P<0.001 for comparison of miR-122/Let7d values between groups indicated.

