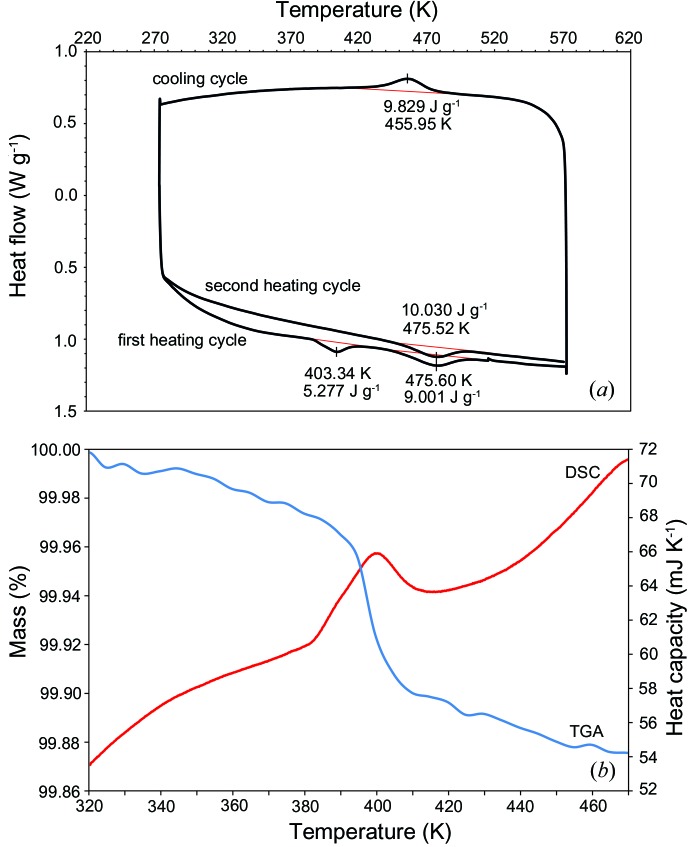
Figure 3.
(a) The α–β transition of cristobalite detected by DSC (sample MBA5/6/99) with an initial heating cycle, a cooling cycle and a second heating cycle. The peaks at ∼475 K on heating and ∼456 K on cooling mark the phase transition. (b) Heat capacity of the anomalous peak centred on ∼403 K and corresponding mass loss measured by TGA. Scanning rate is 10 K min−1.

