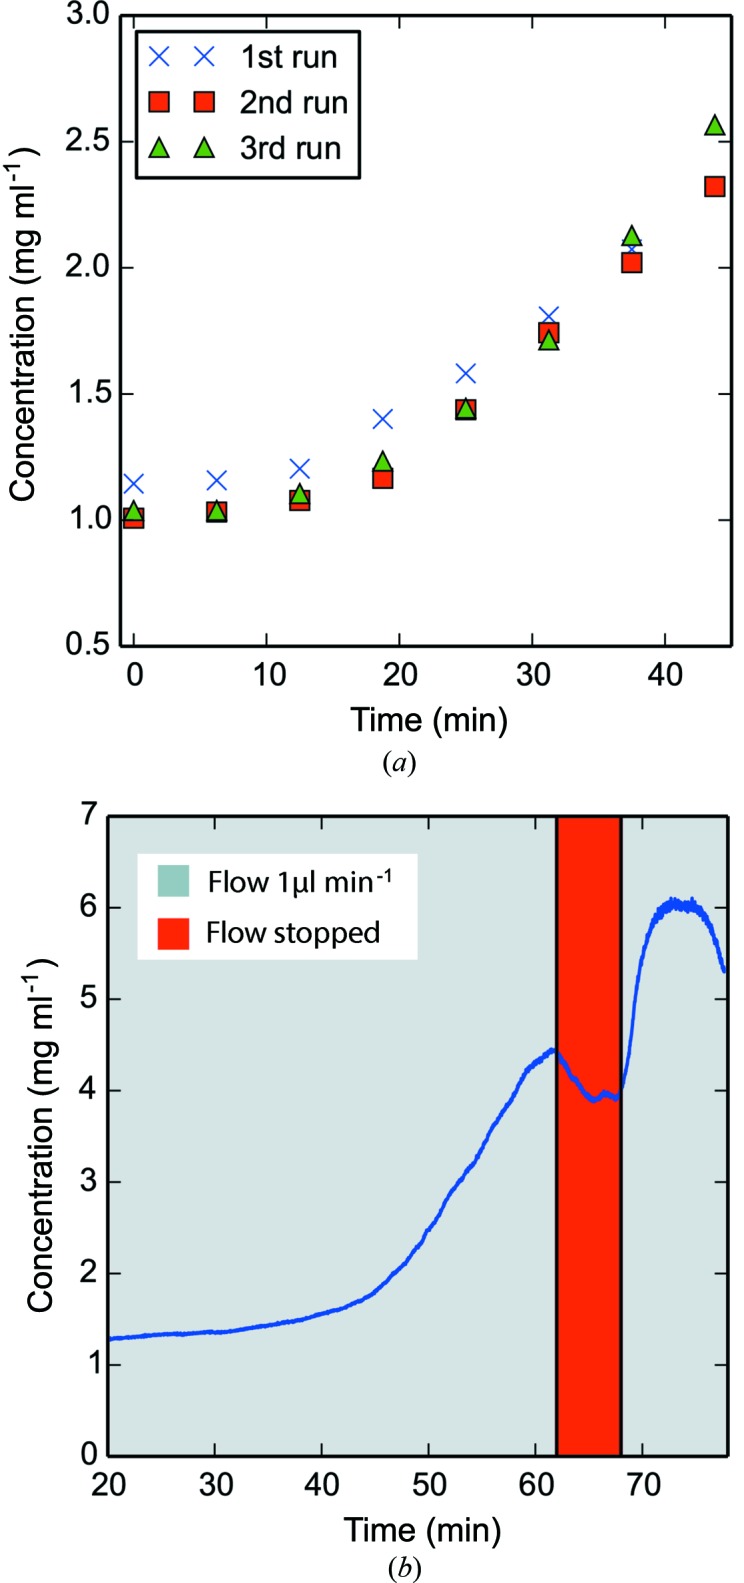
Figure 2.

UV monitoring of protein concentration. (a) Plot of repeated UV-monitored continuous flow concentration series (n = 3). A lysozyme solution of 1 mg ml−1 was pumped into the sample channel of the dialysis chip at a flow rate of 1 µl min−1. PEG was pumped with the opposite flow direction into the PEG channel at 10 µl min−1. The dialysis chip was flushed with sample after 45 min at high flow rate and the experiment was repeated. (b) Running the sample solution at a flow rate of 0.9 µl min−1 will result in a fixed concentration after equilibration (in this case just before the red marking of ‘Flow stopped’ above). Halting the protein solution flow for a period of time can temporarily result in a higher protein concentration. In this case the pump was stopped for 7 min.
