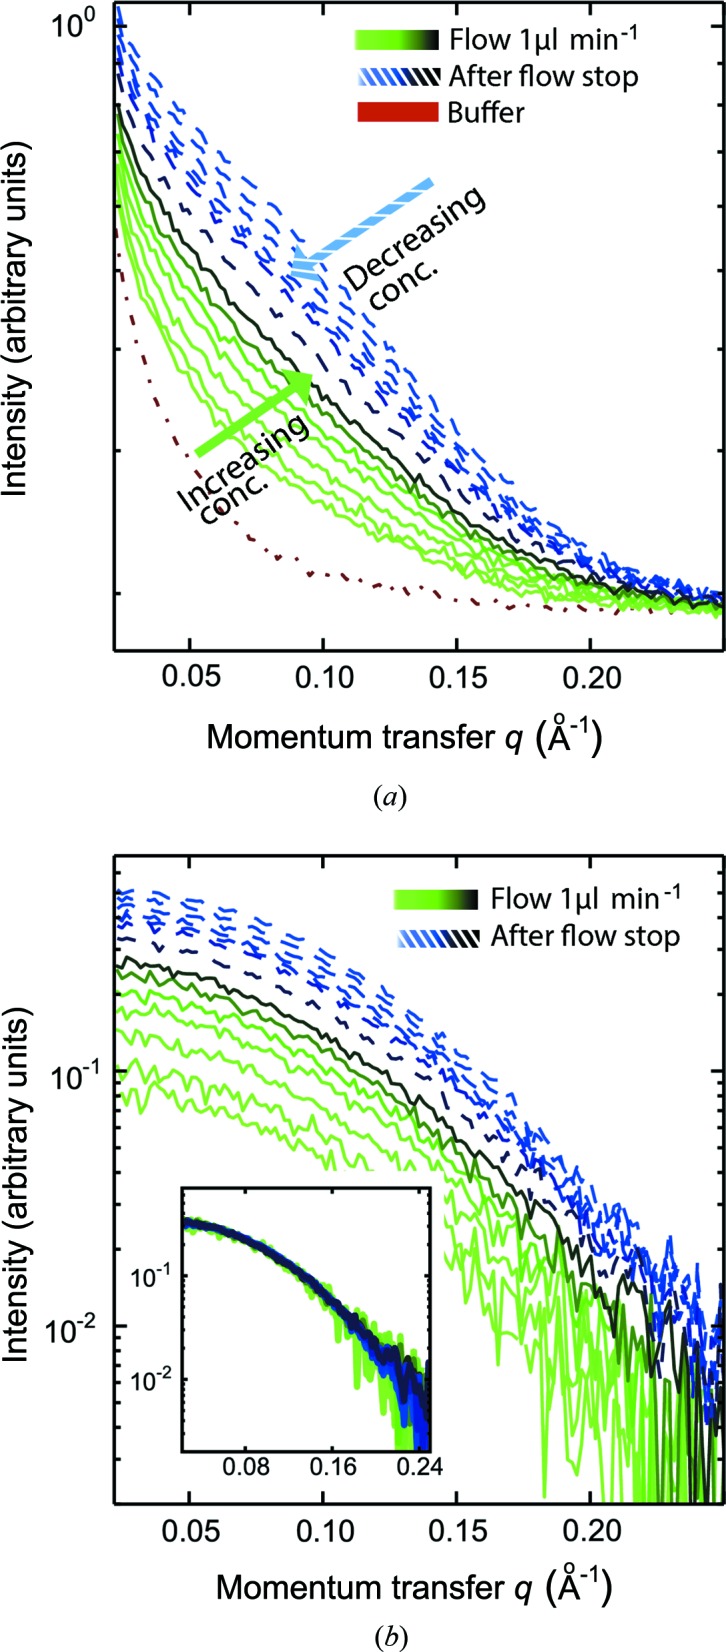
Figure 3.

SAXS-monitored lysozyme concentration series. (a) The scattering curves obtained during data collection from a concentration series on lysozyme with an initial concentration of 2.2 mg ml−1. Two different approaches were used. The green scattering curves (light green to dark green) indicate protein concentration obtained using continuous flow with a sample flow rate of 1 µl min−1 and a PEG flow rate of 10 µl min−1. SAXS data were collected at 5 min intervals. The sample flow was halted for 10 min. The blue scattering curves show the resulting abrupt concentration, when the sample flow was reinitiated at 1 µl min−1, with subsequent dilution (light blue to dark blue). SAXS data (blue curves) were collected with 3 min intervals. The red curve is the scattering curve from buffer solution. SAXS data were not collected during the stopped flow. (b) The background-subtracted data. The inset shows the superimposed data curves after scaling for concentration.
