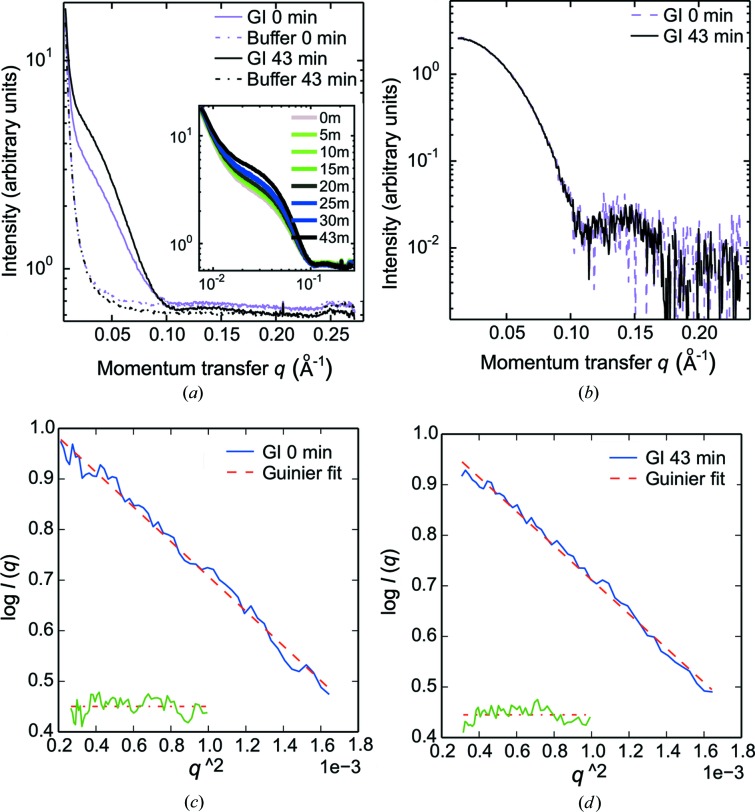
Figure 5.
SAXS-monitored glucose isomerase (GI) concentration series. (a) Concentration of a glucose isomerase solution from 3.4 mg ml−1 at t = 0 min (shown in purple) to 6.5 mg ml−1 at t = 43 min (shown in black). The two corresponding buffer intensity curves are also plotted, one at t = 0 min (purple) and one at t = 43 min (black). The required volume was 40 µl from the first to the last measurement. The sample and the PEG solutions were injected at a rate of 1 µl min−1 and SAXS data were collected every 5 min. The inset shows the gradual concentration of the protein sample. Buffer changes were induced during concentration in the dialysis chip using PEG in water, rather than PEG in the protein buffer. (b) Plot of background-subtracted intensity curves at 3.4 mg ml−1 (purple) and 6.5 mg ml−1 (black) using data from buffers exposed to the same dialysis period as the protein samples for the background-subtraction procedure. (c) For the starting solution at 3.4 mg ml−1, R g = 32.0 Å was determined [qR g(min) = 0.45, qR g(max) = 1.30]. (d) For the final solution at 6.5 mg ml−1 R g = 32.5 Å was determined [qR g(min) = 0.70, qR g(max) = 1.30].

