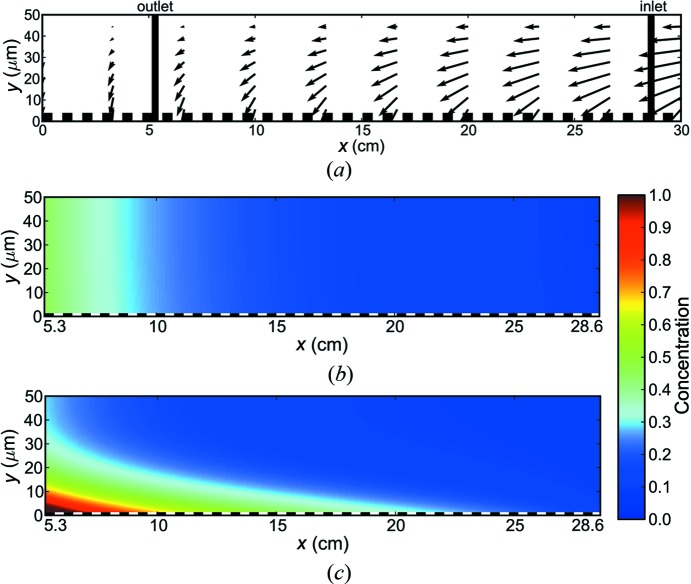
Figure 6.
Fluid simulations inside a dialysis chip. (a) Simulated fluid velocity field inside the chip. Scales and flows are exaggerated for the purpose of illustration. Vertical lines mark inlet and outlet locations. Fluid velocity is strictly vertical at the balance point (x = 0), a virtual location normally outside the chip. The dashed line (y = 0) identifies the membrane surface. (b) Simulations of steady-state concentration profiles for a rapidly diffusing lysozyme-like protein (D = 10−6 cm2 s−1). (c) Simulations of steady-state concentration profiles for a slowly diffusing aggregate (D = 10−8 cm2 s−1). Species slower than D = 5 × 10⁻⁸ cm2 s−1 show a visible concentration gradient within the 50 µm channel.

