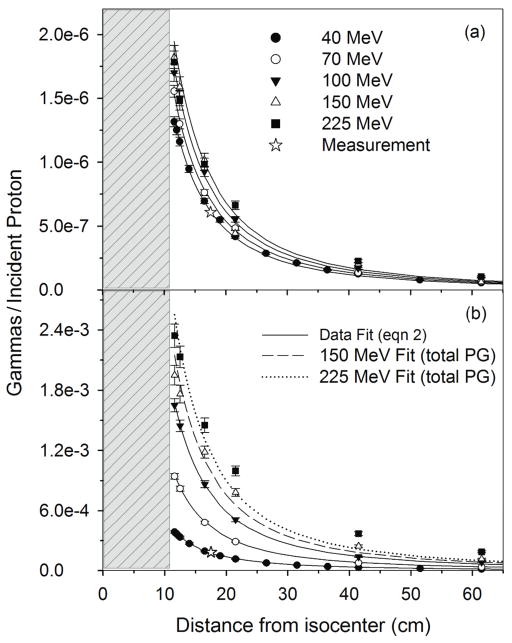
Figure 4.
(a) and (b) for the 7 cm diameter HPGe from irradiation of the 20 cm × 20 cm × 35 cm water phantom as a function of detector distance from nozzle isocenter. Data is shown for the measurement at 40 MeV and 17.5 cm distance, MC calculations (data points) with proton beam energies of 40, 70, 100, 150, and 225 MeV and for the data fit using equation 2. Error bars represent 1-sigma statistical uncertainty of the MC data. The gray region represents the position of the water phantom with respect to isocenter (0 cm).

