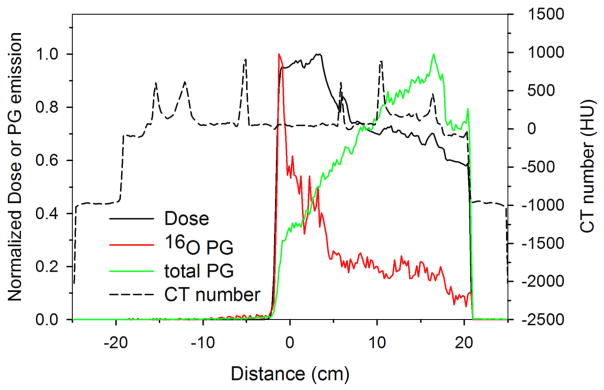
Figure 7.

Profiles along the central axis of the beam (dashed line in figure 6) of dose, 16O PG emission, and total PG emission are shown. Changes to the dose and PG emission with respect to tissue type can be seen by comparing the profiles to the plotted CT number profile.
