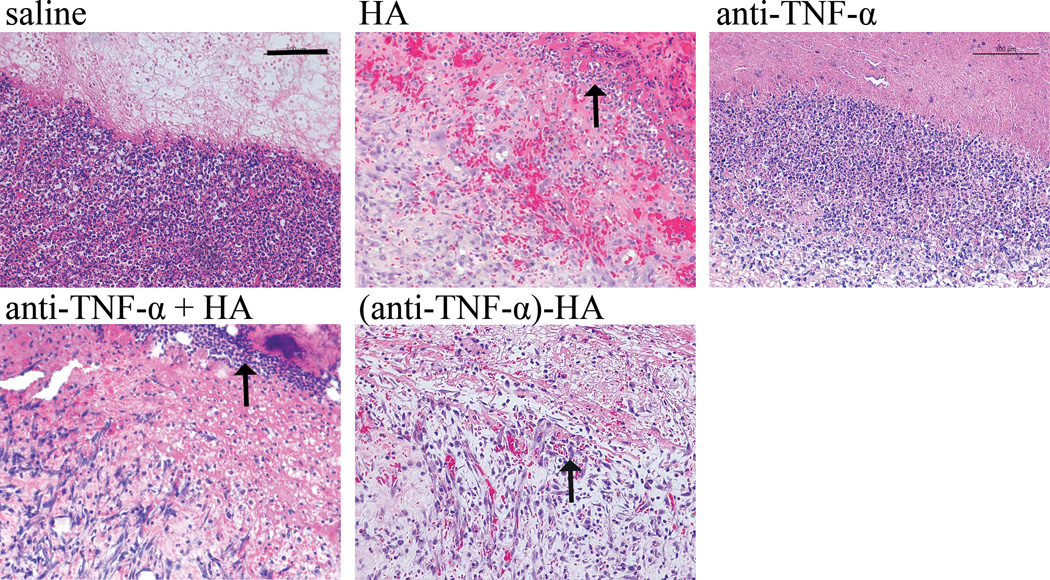
Figure 5.
H & E staining. Day 7 images of the burn at the interface of wound edge and newly formed eschar shows densely populated multinucleated inflammatory immune cells apparent in saline and anti-TNF-α treatments. These immune cells, indicated with an arrow, are less densely populated in HA and anti-TNF-α + HA, with the fewest and most sparse found with (anti-TNF-α)-HA treatments. Scale bar = 200 μm.

