Figure 3.
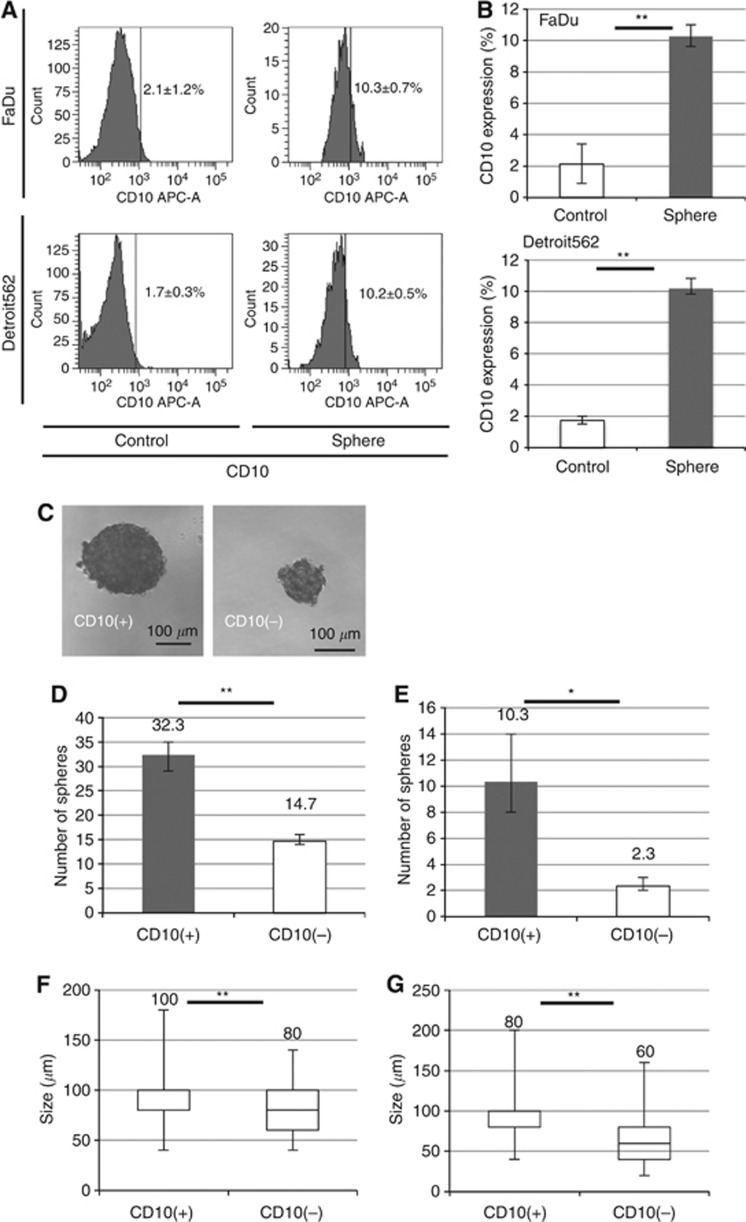
CD10 and sphere formation. (A–B) CD10 expression in sphere cells was compared with that of adherent (control) cells in FaDu and Detroit562 by flow cytometry. (C) CD10(+) and CD10(−) cells were sorted and the morphology of spheroid colonies in FaDu were examined. Representative images are shown. (D–E) The number of spheroid colonies formed in CD10(+)/(−) FaDu (D) and Detroit562 (E) were calculated. (F–G) The sizes of spherical colonies of CD10(+)/(−) in FaDu (F) and Detroit562 (G) were also determined. Data represent means±s.e.m.; *P<0.05; **P<0.01.

