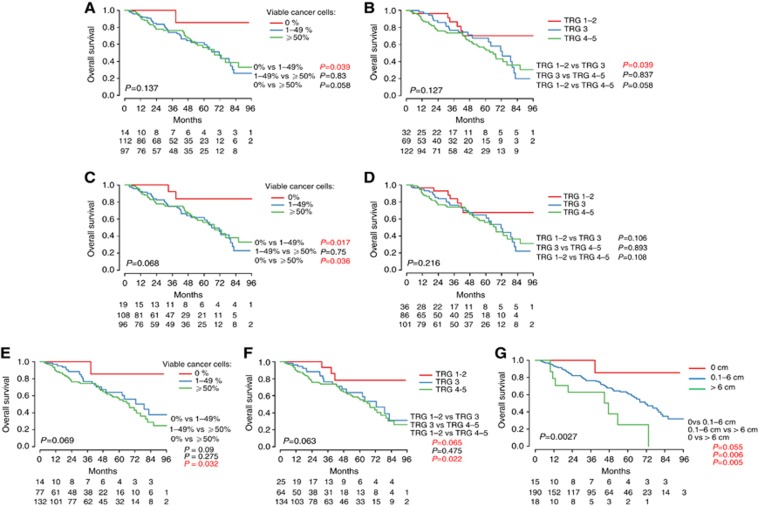
Figure 2.
Kaplan–Meier survival curves according to the methods for the assessment of PR. (A) Mean percentage of remaining cancer cells according to the strict method of Blazer et al, (2008); (B) Mean TRG; (C) Median percentage of remaining cancer cells; (D) Median TRG; (E) Percentage of remaining cancer cells of the ‘worst' nodule; (F) TRG of the ‘worst' nodule according to the strict method of Rubbia-Brandt et al, (2007); (G) New proposed method 

