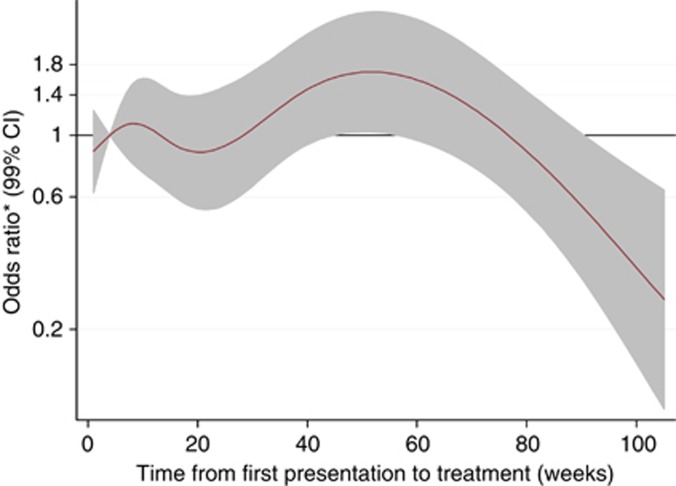
Figure 2.
Spline curve of logistic regression of provider delay (weeks) on odds ratio (shaded area are 99% CIs) of having later stage (C+D) disease at diagnosis after multi-adjustment for potential confounders. Reference category is 4 weeks delay. Model adjusted for age, gender, smoking status, Carstairs deprivation quintile, Charlson index, place of presentation, tumour grade, type of admission, and for symptoms and signs of constipation, rectal bleeding, abdominal pain, anorexia, weight loss and abdominal mass.

