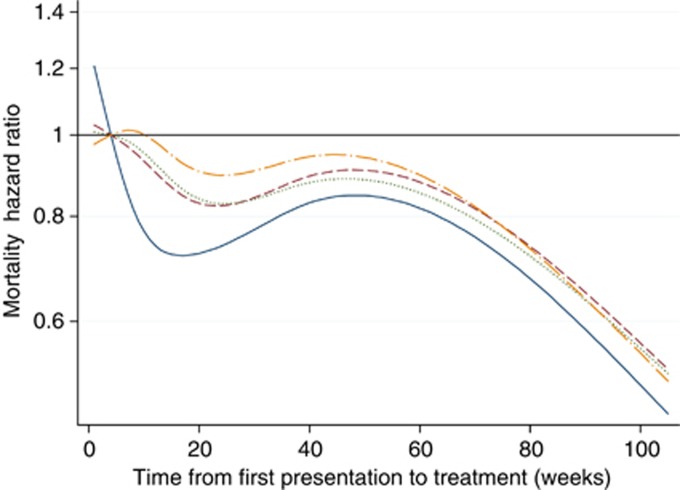
Figure 3.
Spline curve of Cox proportional hazards regression of provider delay (weeks) on hazard ratio for mortality. Model 1 (solid line): unadjusted model with four knots (provider delay of 4 weeks used as reference). Model 2 (dashed line): adjusted for place of presentation, patient age, patient gender, smoking status, Carstairs deprivation quintile and Charlson index. Model 3 (dotted line): further adjusted for tumour grade and type of admission. Model 4 (long dash and dotted line): further adjusted for symptoms and signs of constipation, rectal bleeding, abdominal pain, anorexia, weight loss and abdominal mass.

