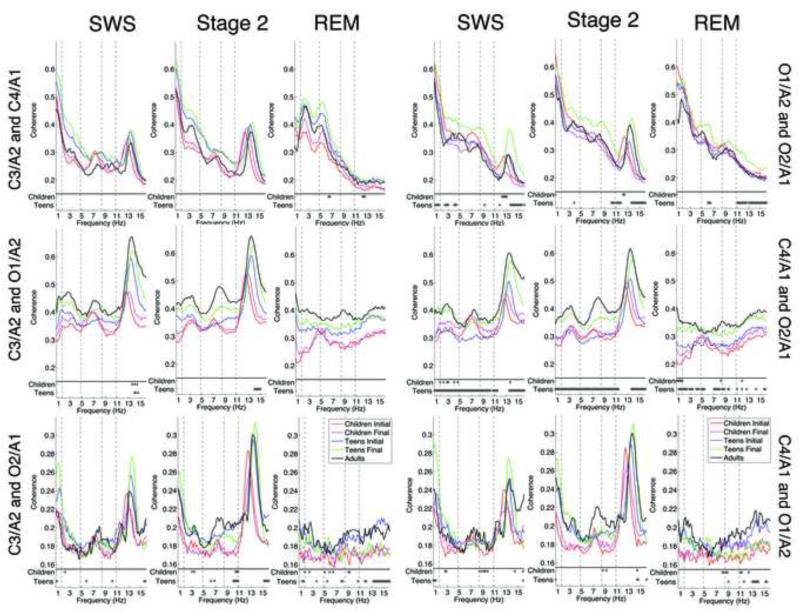
Figure 1. Intra- and Inter- Hemispheric and Diagonal Coherence for SWS, Stage 2 and REM sleep.
The top plots correspond to mean interhemispheric coherence between the two central (left figure) and two occipital (right figure) electrodes, the second row correspond to left (left figure) and right (right figure) intrahemispheric coherence, and the third row is coherence between diagonal electrodes. At the bottom of each individual plot, separated from the rest of the plot by a horizontal line, are the statistical results obtained from the bootstrap analysis. Asterisks correspond to frequency bins that were statistically significantly different between the Initial and Follow-Up session for the children (Children) and teen (Teens) cohorts at p < .05.

