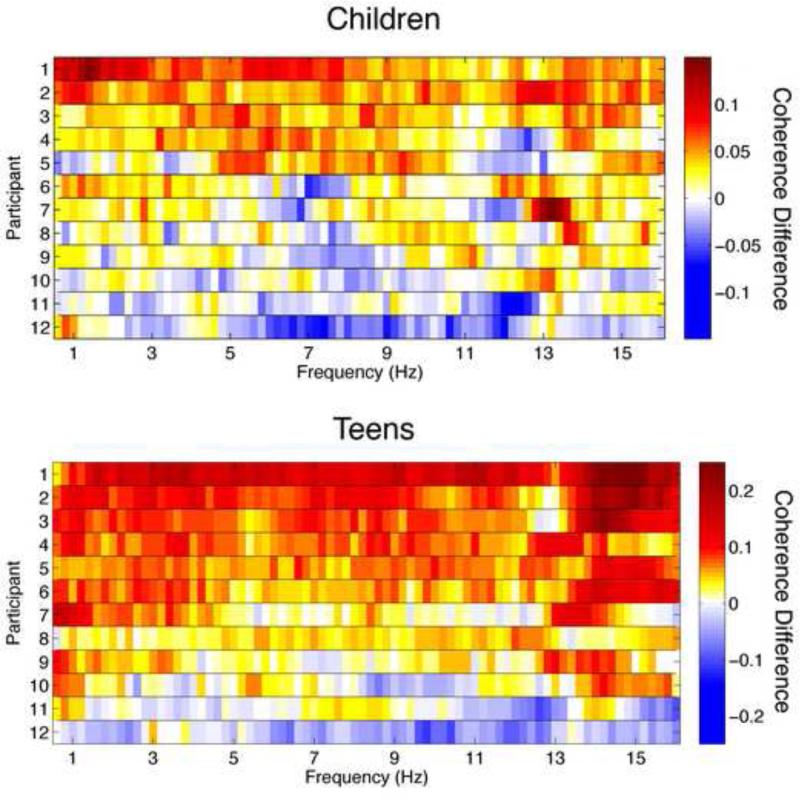
Figure 2. Individual data for right intrahemispheric coherence during SWS for Children (Top) and Teens (Bottom).
Coherence at the follow-up session minus coherence at the initial session for all frequency bins and subjects are illustrated. Warm colors are indicative of increases in coherence between assessments, cool colors denote decreases in coherence and values of zero (no change in coherence) are shown in white. Note that the two plots are on different scales, and changes in coherence are larger for the teen cohort.

