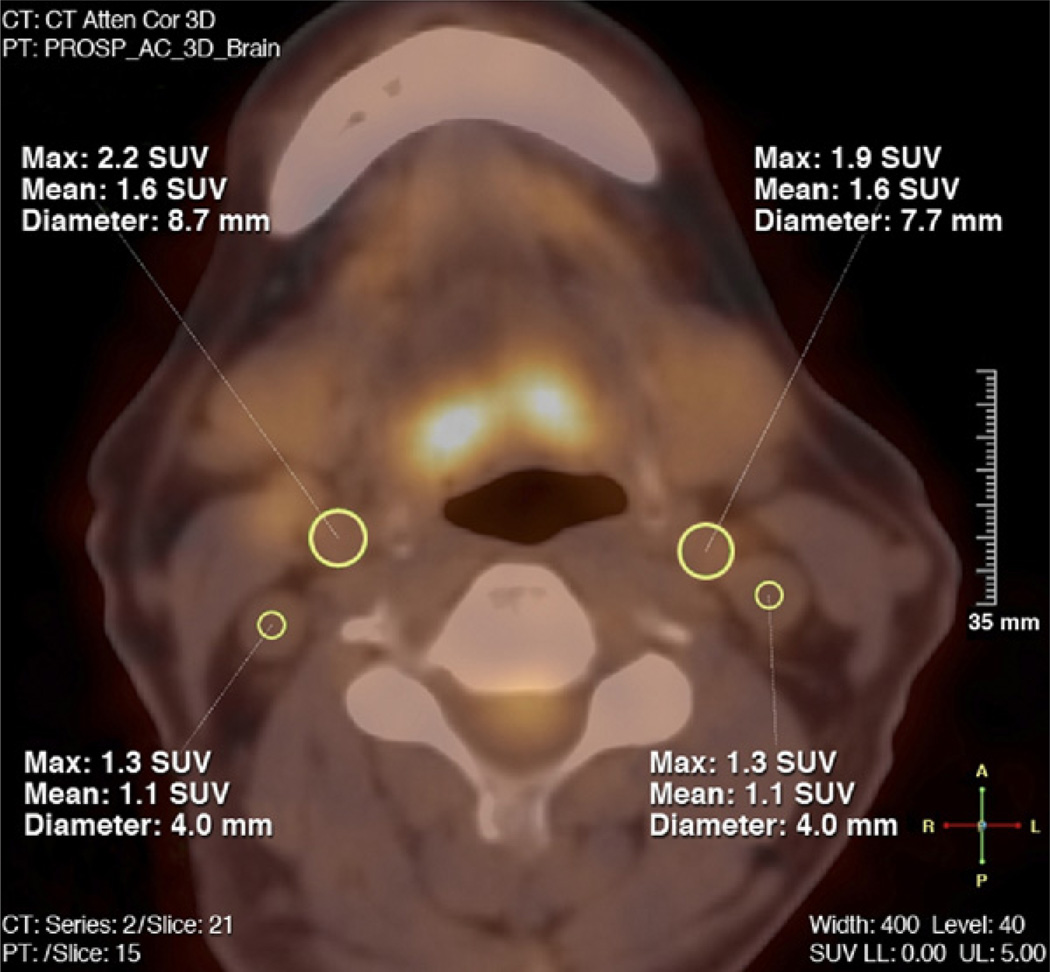
Figure 1. FDG-PET Image Analysis.
This figure shows 1 slice of the fused positron emission tomography/computed tomography (PET/CT) images of the neck in transaxial view. Regions of interest (ROIs) (yellow) drawn around the outer border of the vessel walls of the left and right common carotid arteries, as well as, for evaluation of the 18F-fluorodeoxyglucose (FDG) blood pool activity, within the lumen of both jugular veins (SUVmax, SUVmean, and diameter of the ROIs). SUV = standardized uptake value.

