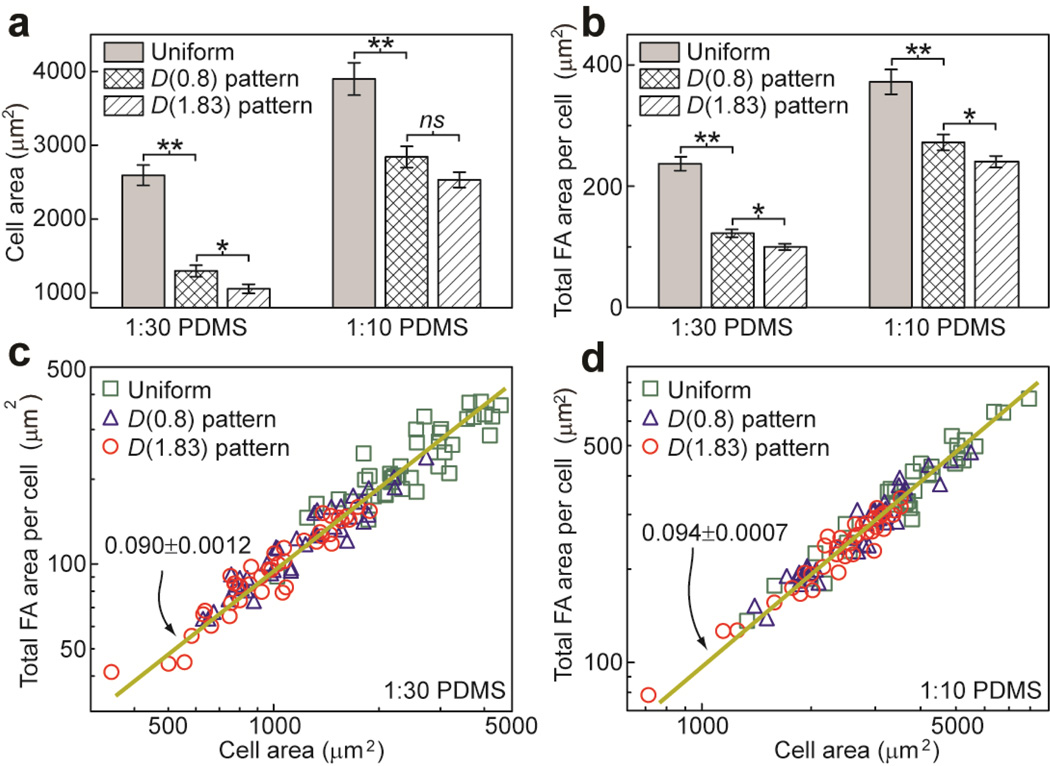
Figure 5.
Quantitative and correlative analysis of NIH/3T3 cells plated on 1:10 and 1:30 flat PDMS substrates coated with different adhesive ECM patterns. (a&b) Column plots of cell spread area (a) and total FA area per cell (b) as a function of PDMS substrate rigidity and adhesive ECM pattern as indicated. Error bars represent ± s.e.m. P-values calculated using the paired student’s t-test were indicated for statistically significant differences (P > 0.05 (not significant, or ns), P < 0.05 (*), and P < 0.005 (**)). (c&d) Total FA area per cell versus cell spread area plotted for 1:30 (c) and 1:10 (d) flat PDMS substrates coated with different ECM patterns as indicated. Data trends were plotted using linear least square fitting (dark yellow lines), with the slope values ± s.e.m indicated.

