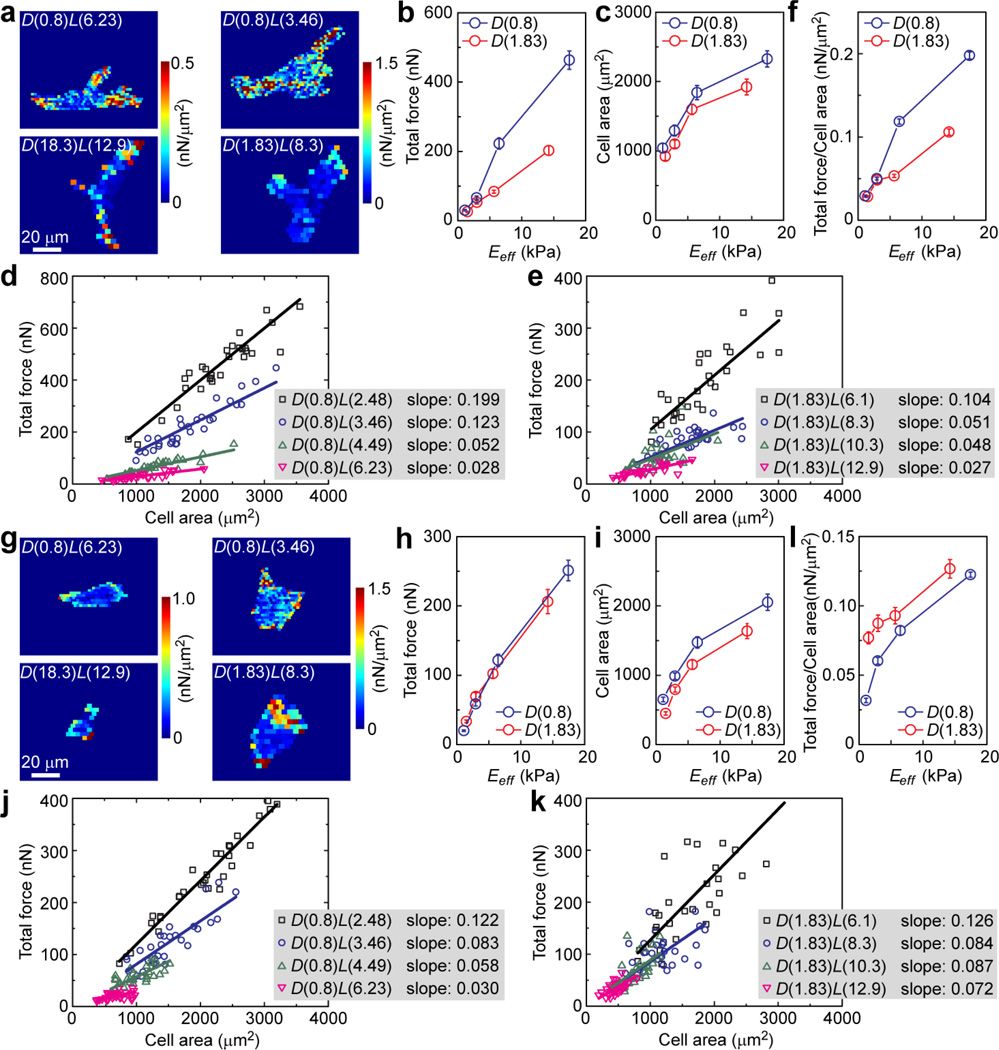
Figure 6.
Quantitative and correlative analysis of intracellular cytoskeletal contractility for NIH/3T3 (a–f) and HUVECs (g–l) plated on the PDMS micropost arrays of different geometries and rigidities. a and g are representative colorimetric maps of contractile stress (defined here as the ratio of traction force to micropost top surface area) for single NIH/3T3 (a) and HUVECs (g) plated on the PDMS micropost arrays of different geometries but with comparable rigidities as indicated. Total traction force (b, h), cell spread area (c, i), and total traction force per cell area (f, l) were plotted against Eeff. Error bars represent the s.e.m., and n = 30 for each condition. Single cell data of total traction force was plotted against cell spread area for micropost array set D(0.8) (d, j) and set D(1.83) (e, k). Each data point in d, e, j and k represents an individual cell, and data trends were plotted using linear least square fitting with the slopes indicated.

