
Figure 2.
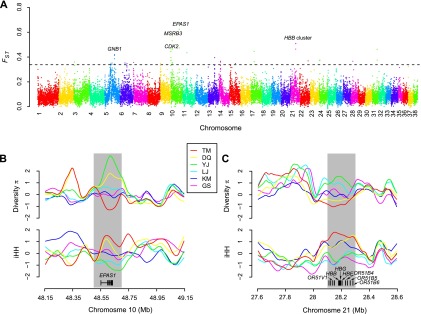
Selective sweep analysis of the breeds from different altitude levels. (A) Manhattan plot of FST among the high- (TM, DQ), middle- (LJ), and low- (YJ, KM, GS) altitude breeds. The FST was calculated for each 100-kb autosomal window. The dashed line denotes a threshold of Z(FST) = 5. (B) Diversity π and iHH around the EPAS1 loci. The region with Z(FST) > 5 is shaded. π and iHH were calculated for each 10-kb window and Z-transformed on the genome scale. The values were smoothed by lowess regression. (C) π and iHH around the beta hemoglobin loci.