
Figure 3.
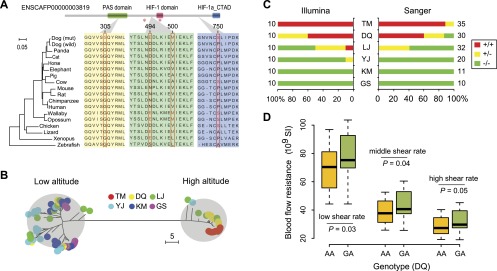
EPAS1 mutations in the coding region. (A) Structural and evolutionary analysis of the four amino acid variants. The protein coordinate is based on Ensembl ID ENSCAFP00000003819. The coordinate of NCBI RefSeq XP_531807.2 is slightly different but the variants remain the same. The upper panel shows the Pfam domains of the protein. The orthologous protein sequences from 17 vertebrates are aligned with the mutant residues shown in red. The NJ tree derived from the multiple alignment is shown in the left panel. The red stars indicate two hydroxylation sites (Pro405 and Pro531), which are essential for oxygen sensing (Patel and Simon 2008). (PAS) Per-Arnt-Sim; (HIF) hypoxia-inducible factor; (CTAD) C-terminal transactivation domain. (B) NJ tree of the 8-kb haplotypes comprising the four nonsynonymous mutations. The evolutionary distance is defined as the number of different nucleotides between haplotypes. The haplotypes from high- and low-altitude breeds were grouped into two distinct clades. (C) Percentages of homozygotes and heterozygotes in the six breeds. The mutant and reference alleles are represented by “+” and “−”, respectively. Besides the 60 dogs sequenced with the Illumina technology, additional samples were genotyped with Sanger sequencing. The sample size is shown beside the bars. (D) Association between EPAS1 genotypes (mutant allele, A; reference allele, G) and blood flow resistance in DQ. The blood flow resistance was measured at different shear rates. In the boxplot, the line within the box defines the median; the ends of the boxes define the 25th and 75th percentiles; and the error bars define the 10th and 90th percentiles. The ANOVA F-test was performed, taking the age as covariant.