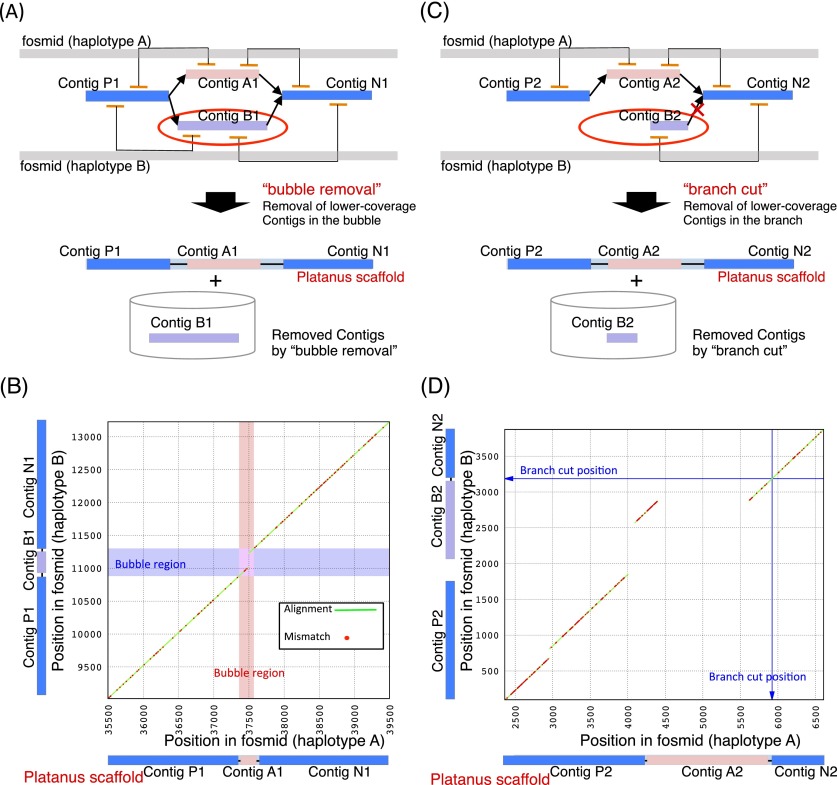
Figure 4.
Example of a heterozygous region resolved by “bubble removal” and “branch cut.” (A) Schematic model of “bubble removal” in Platanus scaffolding. (B) Alignment dot plot between two fosmids. Green lines and red dots indicate alignments and mismatches, respectively. Red and blue boxes indicate the regions corresponding to the bubbles. (C) Schematic model of “branch cut” in Platanus scaffolding. (D) Alignment dot plot between two fosmids. Green lines and red dots indicate alignments and mismatches, respectively. The blue arrow indicates the position corresponding to the root of the branch.

