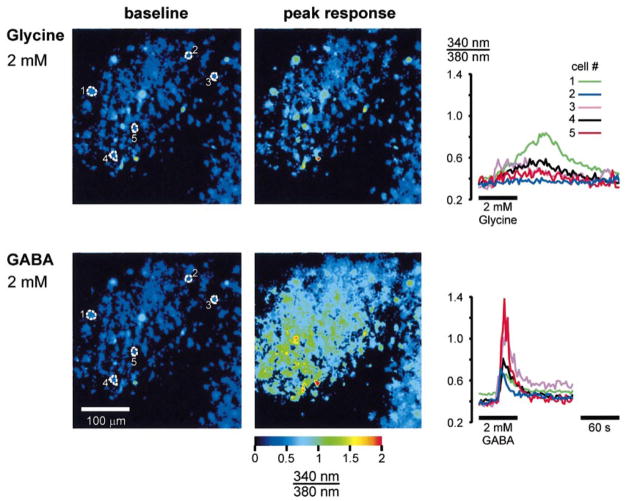
Fig. 3.
Glycine and GABA-elicited calcium responses in immature lateral superior olive (LSO) neurons. Top row: 340 : 380 ratio images before (baseline) and at the peak of the response following bath application of 2 mM glycine. The graph on the right illustrates the time-course of the response of the five cells outlined in the baseline image. Bottom row: response of the same LSO to bath application of 2 mM GABA. Notice that many more cells respond to GABA than to glycine. GABAergic responses also have a more rapid onset and higher amplitudes. The slice was prepared from a P3 rat. Dorsal is up and medial is to the right in all panels.

