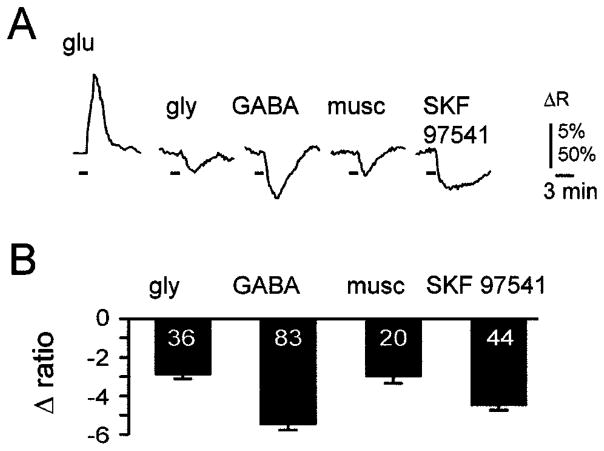
Fig. 8.
Glycine and GABA slightly decrease [Ca2+]i in 2-week-old animals. (A) Averaged responses of 20 cells from a P14 rat slice following applications of glutamate, glycine or GABA receptor agonists. Horizontal bars indicate agonist applications. Vertical scale bar represents changes in 340 : 380 ratio and is 50% for glutamate response and 5% for all others. (B) Average peak responses from lateral superior olive neurons in slices from eight P13 to P15 animals. Numbers within the bars indicate the number of cells.

