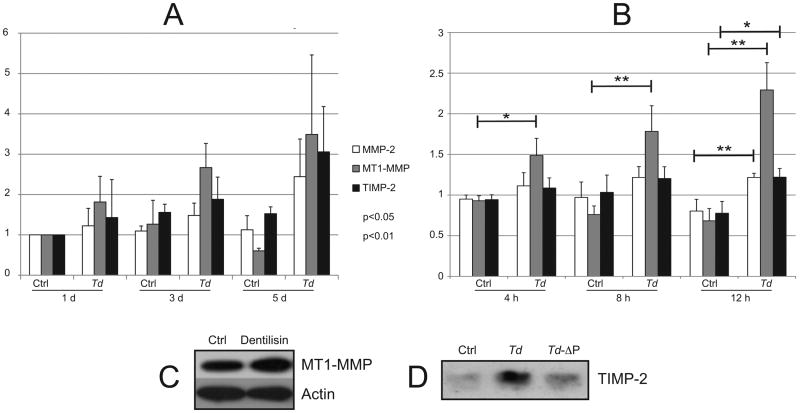
Figure 3. Expression of MMP-2, MT1/MMP and TIMP-2 following T. denticola challenge.
Panels A and B: Transcript levels in PDL cells after T. denticola challenge and incubation in fresh medium for indicated times, assayed by qRT-PCR. The Y-axis in each panel represents fold-expression level of each gene relative to unchallenged control at day 1 shown in Panel A. Panel A: gene expression after 2h T. denticola challenge and incubation in fresh medium for 1, 3 or 5 days. Panel B: gene expression after 4h, 8h or 24h T. denticola challenge and incubation in fresh medium for 24h. Data were analyzed using Student's t-test. Panel C: Western blots showing levels of MT1-MMP expression in PDL cells treated with purified dentilisin (50 ng/ml, 2h) or media control (Ctrl), then washed and maintained in fresh media for 5 days (MT1-MMP1 antibody; Abcam; actin antibody). Panel D: Western blot of TIMP-2 expression in PDL cells (conditioned media) treated for 2h with wildtype T. denticola, T. denticola dentilisin mutant (Td-ΔP) or media control (Ctrl), then washed and maintained in antibiotic supplemented media for 5 days (TIMP-2 antibody, Triple Point Biologics).

